
Methodology, Parameters, and Calculations
Parameter definitions, formulas, uncertainty ranges, and data sources.
Keywords
health economics methodology, clinical trial cost analysis, medical research ROI, cost-benefit analysis healthcare, sensitivity analysis, Monte Carlo simulation, DALY calculation, pragmatic clinical trials
Overview
This appendix documents all 14 parameters used in the analysis, organized by type:
- External sources (peer-reviewed): 9
- Calculated values: 3
- Core definitions: 2
Calculated Values
Parameters derived from mathematical formulas and economic models.
Pragmatic Trial Cost Reduction Factor: 44.1x
Note📊 Details
Cost reduction factor projected for embedded pragmatic trials (traditional Phase 3 cost / pragmatic trial cost per patient)
Inputs:
- Phase 3 Cost per Patient 📊: $41,000 (95% CI: $20,000 - $120,000)
- Pragmatic Trial Cost per Patient 📊: $929 (95% CI: $97 - $3,000)
\[ \begin{gathered} k_{reduce} \\ = \frac{Cost_{P3,pt}}{Cost_{pragmatic,pt}} \\ = \frac{\$41K}{\$929} \\ = 44.1 \end{gathered} \]
✓ High confidence
Sensitivity Analysis
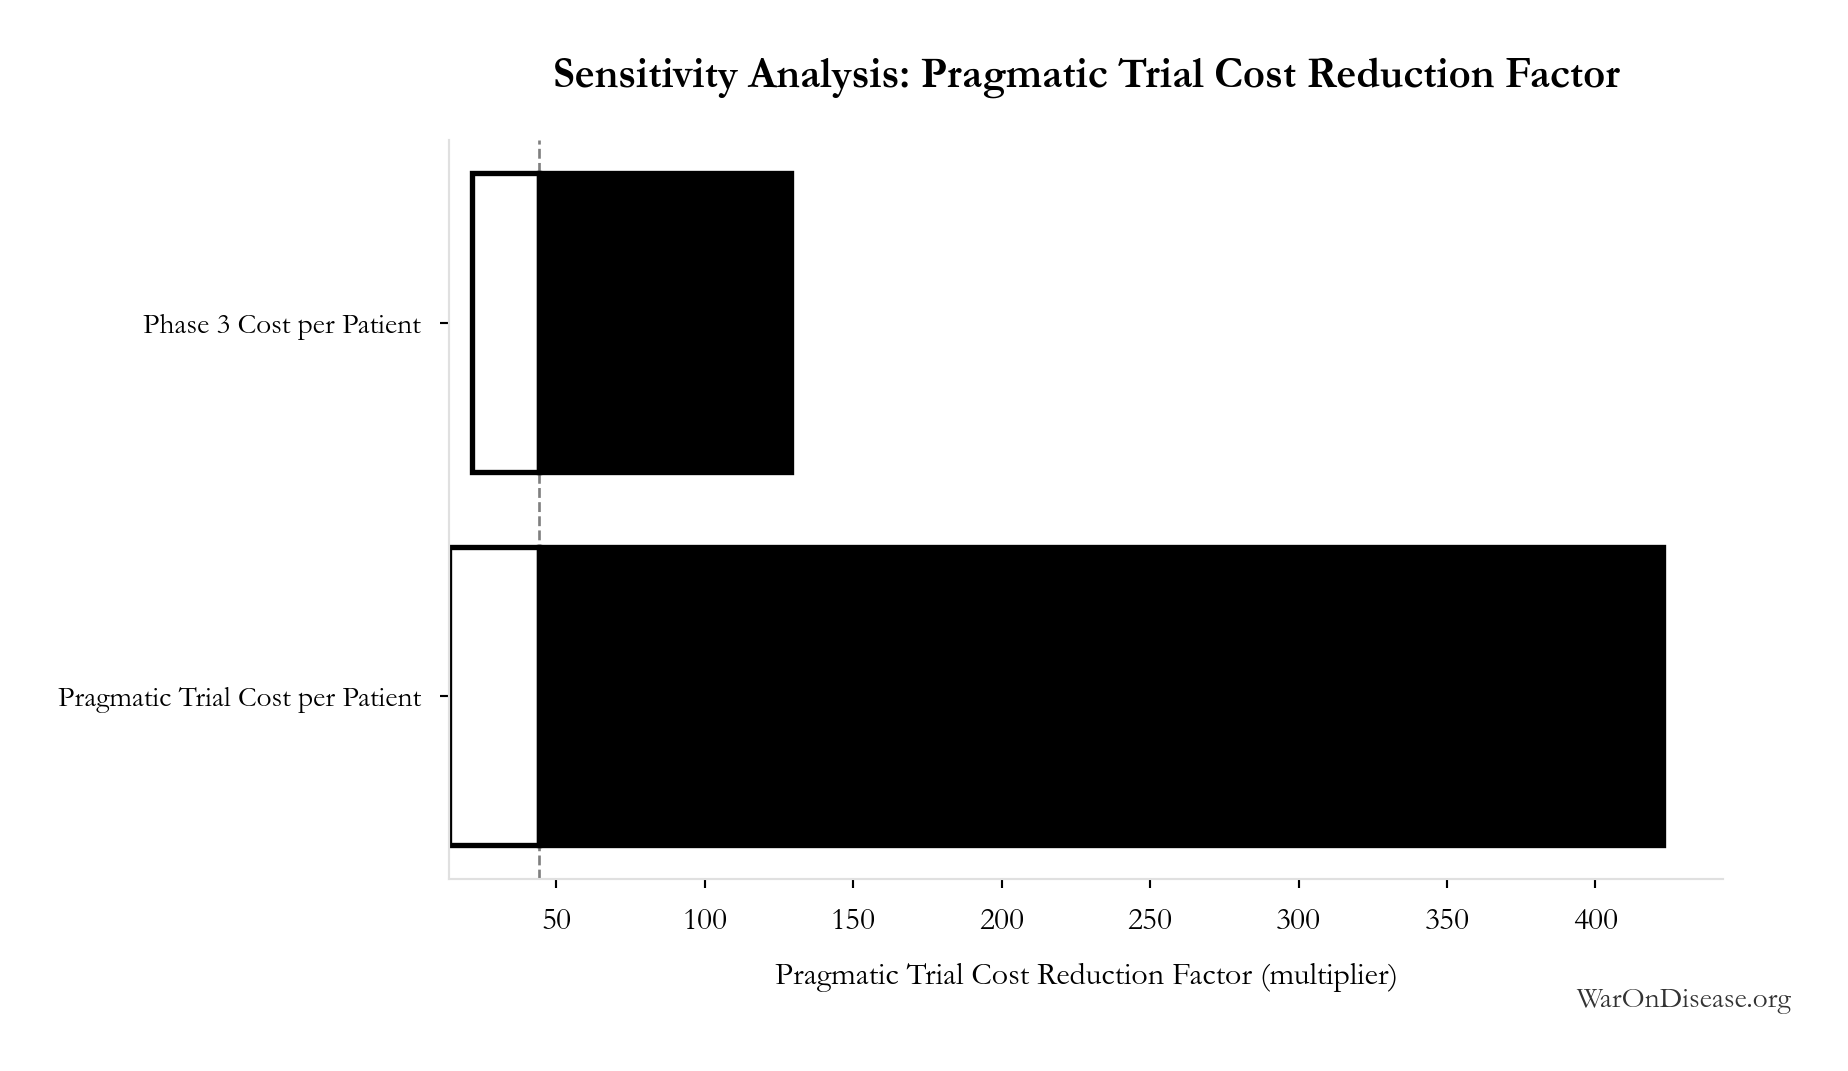
Sensitivity Indices for Pragmatic Trial Cost Reduction Factor
Regression-based sensitivity showing which inputs explain the most variance in the output.
| Input Parameter | Sensitivity Coefficient | Interpretation |
|---|---|---|
| Phase 3 Cost per Patient (USD/patient) | 0.5310 | Strong driver |
| Pragmatic Trial Cost per Patient (USD/patient) | -0.4880 | Moderate driver |
Interpretation: Standardized coefficients show the change in output (in SD units) per 1 SD change in input. Values near ±1 indicate strong influence; values exceeding ±1 may occur with correlated inputs.
Monte Carlo Distribution
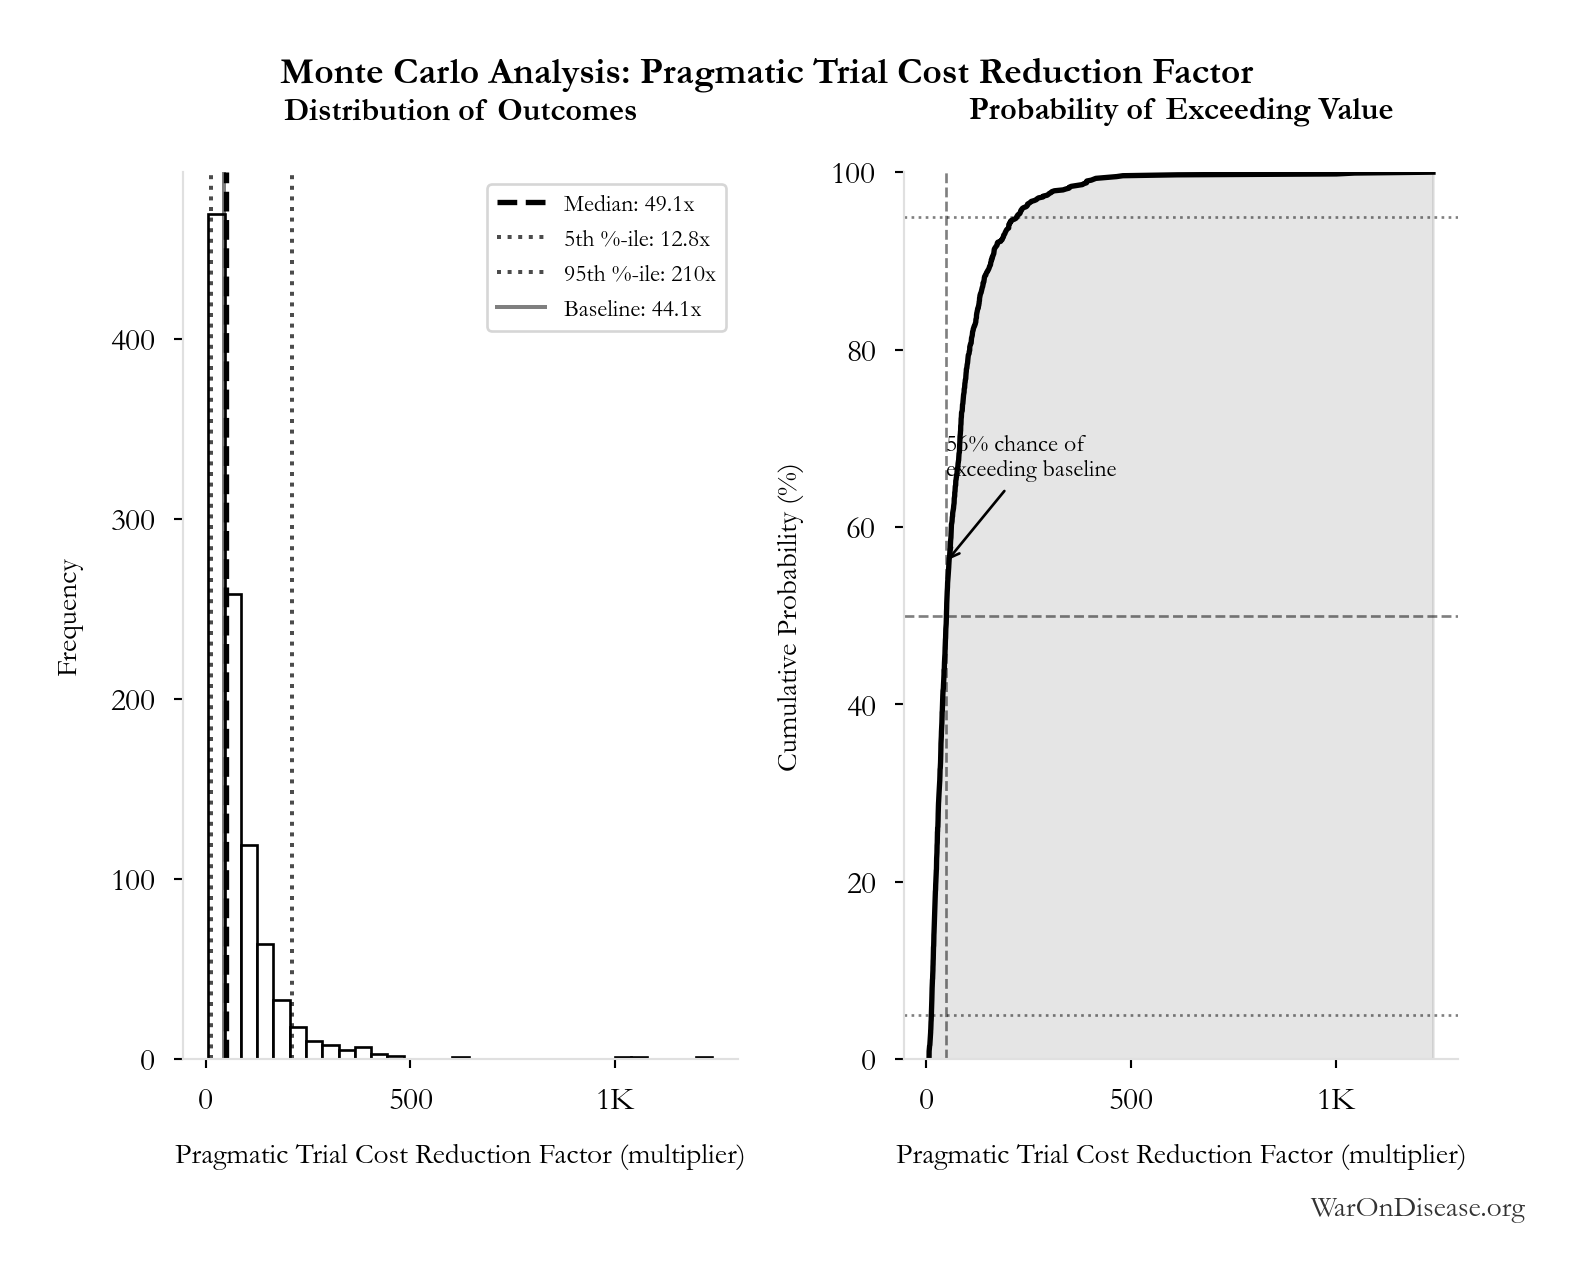
Simulation Results Summary: Pragmatic Trial Cost Reduction Factor
| Statistic | Value |
|---|---|
| Baseline (deterministic) | 44.1x |
| Mean (expected value) | 73x |
| Median (50th percentile) | 49.1x |
| Standard Deviation | 78.5x |
| 90% Range (5th-95th percentile) | [12.8x, 210x] |
The histogram shows the distribution of Pragmatic Trial Cost Reduction Factor across 10,000 Monte Carlo simulations. The CDF (right) shows the probability of the outcome exceeding any given value, which is useful for risk assessment.
Exceedance Probability
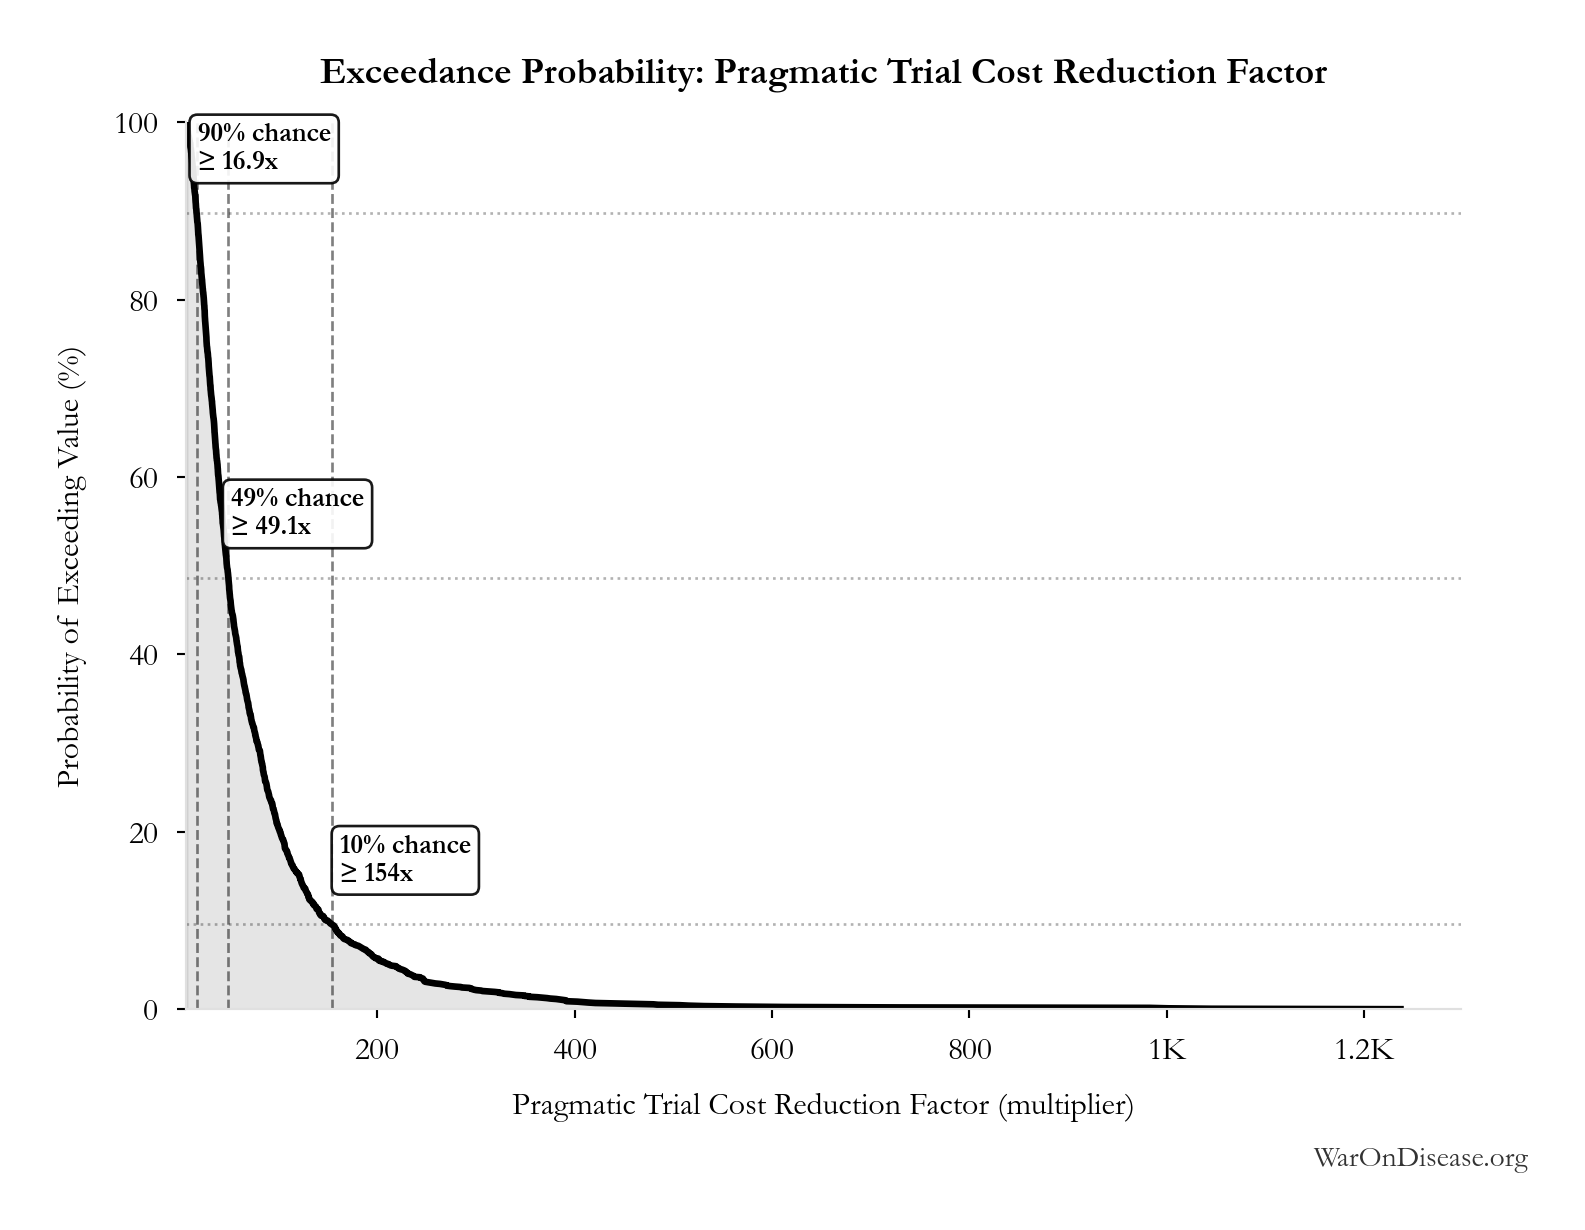
This exceedance probability chart shows the likelihood that Pragmatic Trial Cost Reduction Factor will exceed any given threshold. Higher curves indicate more favorable outcomes with greater certainty.
Total Deaths from Historical Progress Delays: 102 million deaths
Note📊 Details
Total deaths from delaying existing drugs over 8.2-year efficacy lag. One-time impact of eliminating Phase 2-4 testing delay for drugs already approved 1962-2024. Based on Lichtenberg (2019) estimate of 12M lives saved annually × 8.2 years efficacy lag. Excludes innovation acceleration effects.
Inputs:
- Annual Lives Saved by Pharmaceuticals 🔢: 12.4 million deaths
- Regulatory Delay for Efficacy Testing Post-Safety Verification 📊: 8.2 years (SE: ±2 years)
\[ \begin{gathered} Deaths_{lag,total} \\ = Lives_{saved,annual} \times T_{lag} \\ = 12.4M \times 8.2 \\ = 102M \end{gathered} \] where: \[ \begin{gathered} Lives_{saved,annual} \\ = \frac{LY_{saved,annual}}{T_{ext}} \\ = \frac{149M}{12} \\ = 12.4M \end{gathered} \] ~ Medium confidence
Sensitivity Analysis
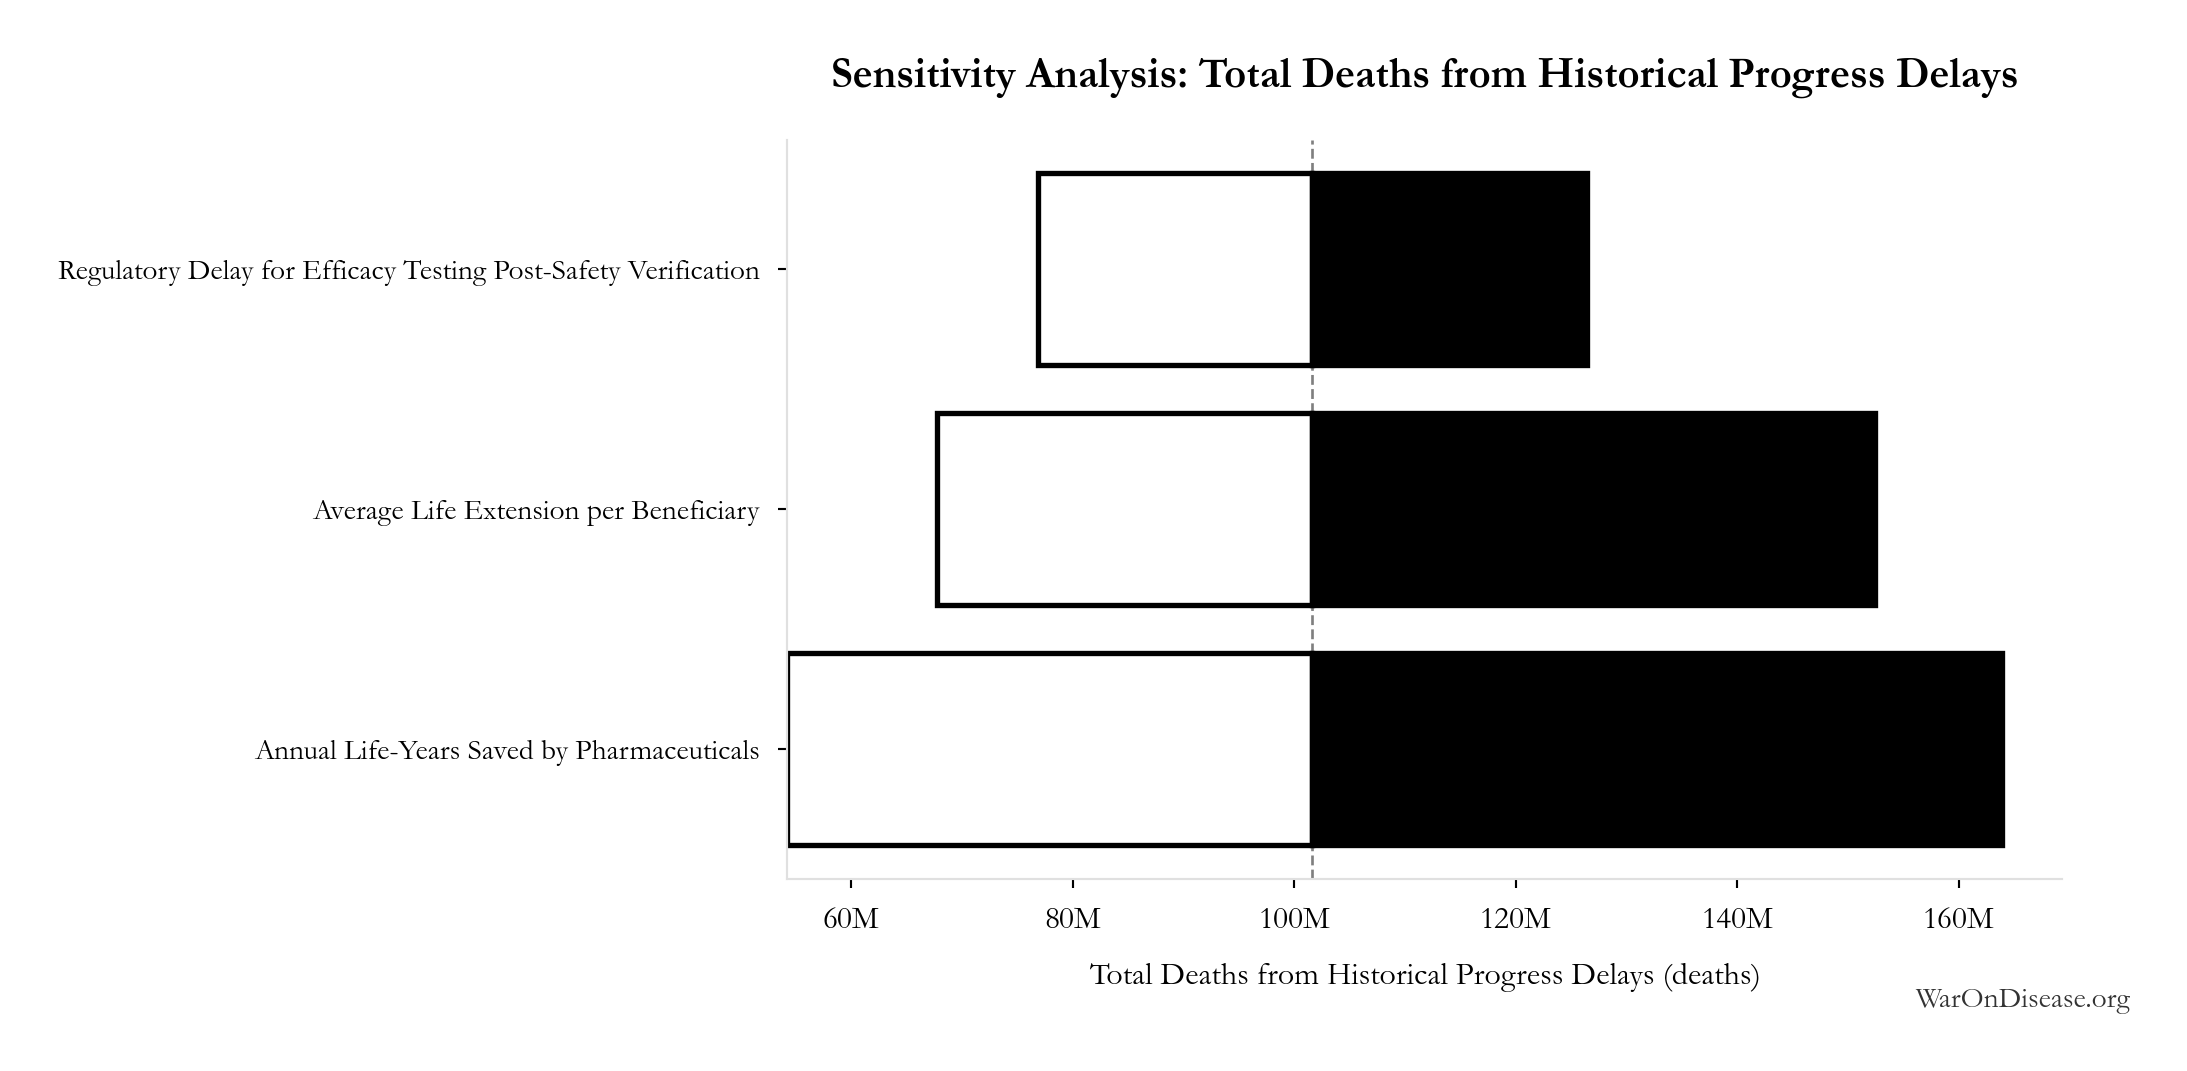
Sensitivity Indices for Total Deaths from Historical Progress Delays
Regression-based sensitivity showing which inputs explain the most variance in the output.
| Input Parameter | Sensitivity Coefficient | Interpretation |
|---|---|---|
| Annual Lives Saved by Pharmaceuticals (deaths) | 0.7195 | Strong driver |
| Regulatory Delay for Efficacy Testing Post-Safety Verification (years) | 0.6685 | Strong driver |
Interpretation: Standardized coefficients show the change in output (in SD units) per 1 SD change in input. Values near ±1 indicate strong influence; values exceeding ±1 may occur with correlated inputs.
Monte Carlo Distribution
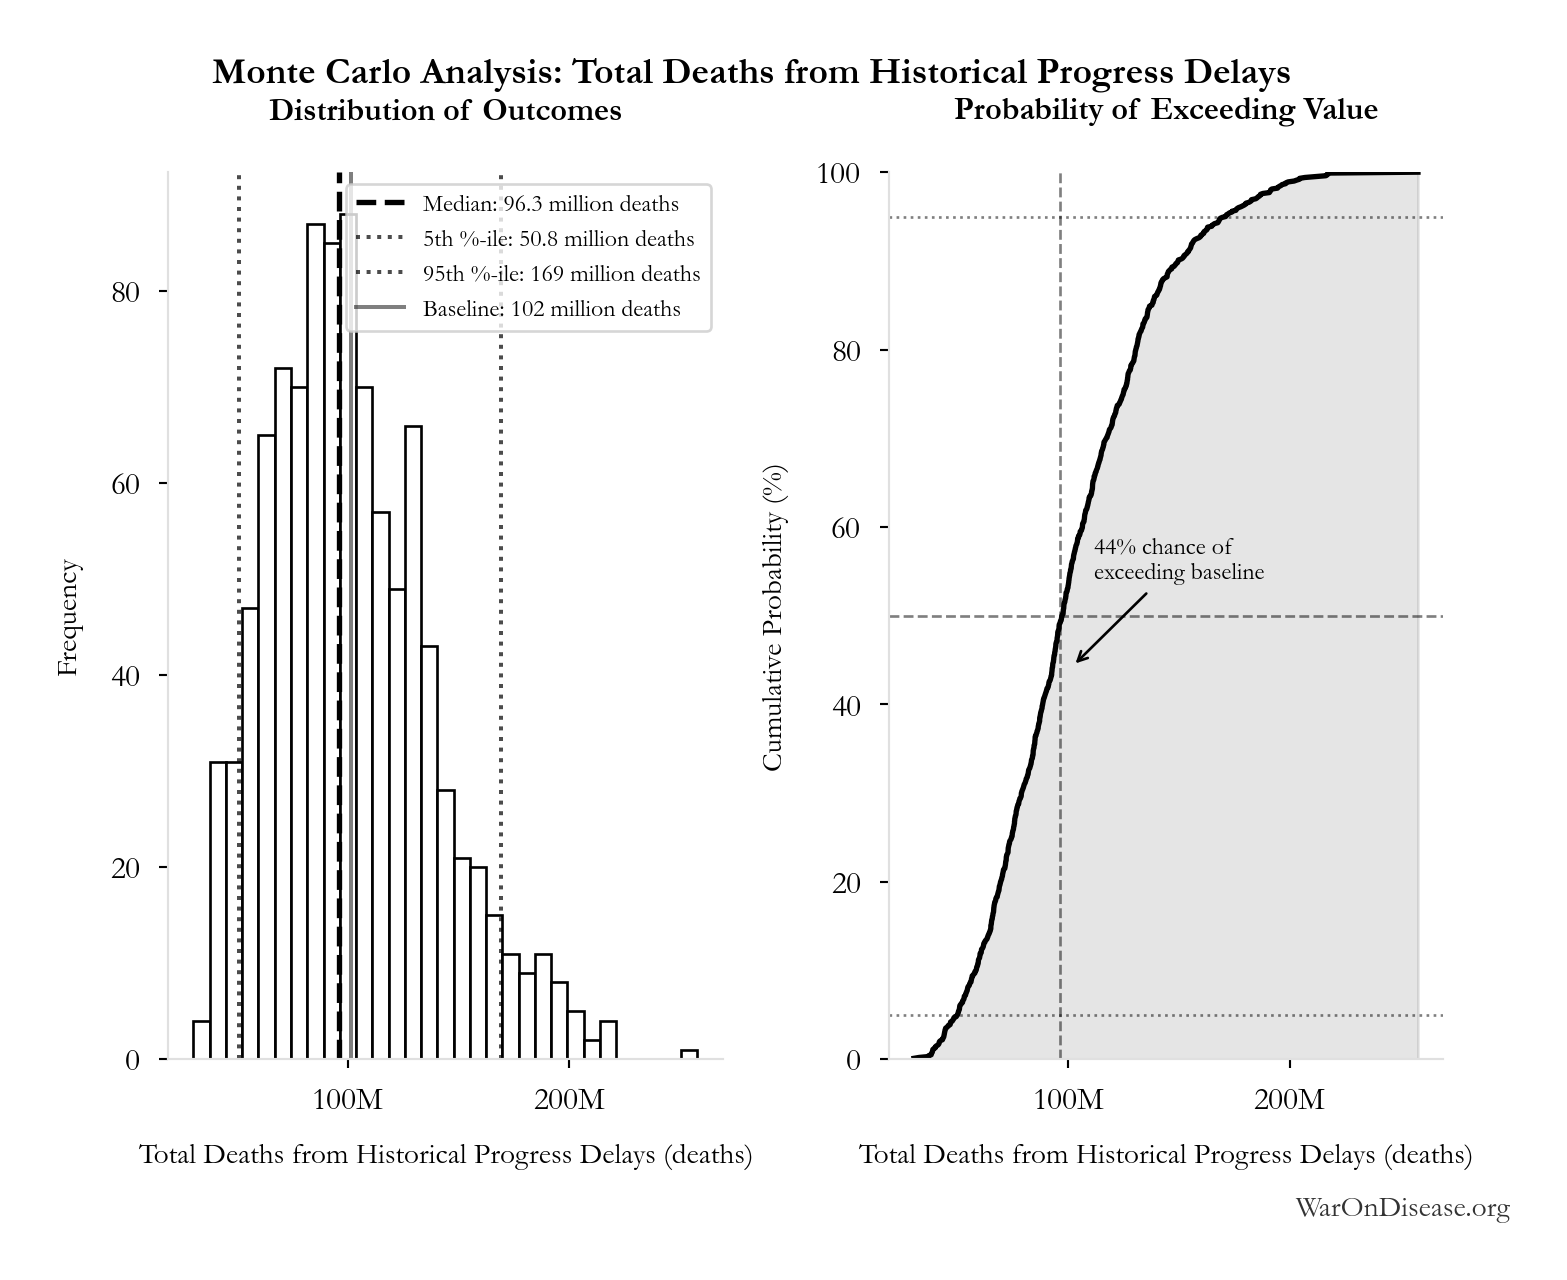
Simulation Results Summary: Total Deaths from Historical Progress Delays
| Statistic | Value |
|---|---|
| Baseline (deterministic) | 102 million |
| Mean (expected value) | 101 million |
| Median (50th percentile) | 96.3 million |
| Standard Deviation | 36.3 million |
| 90% Range (5th-95th percentile) | [50.8 million, 169 million] |
The histogram shows the distribution of Total Deaths from Historical Progress Delays across 10,000 Monte Carlo simulations. The CDF (right) shows the probability of the outcome exceeding any given value, which is useful for risk assessment.
Exceedance Probability
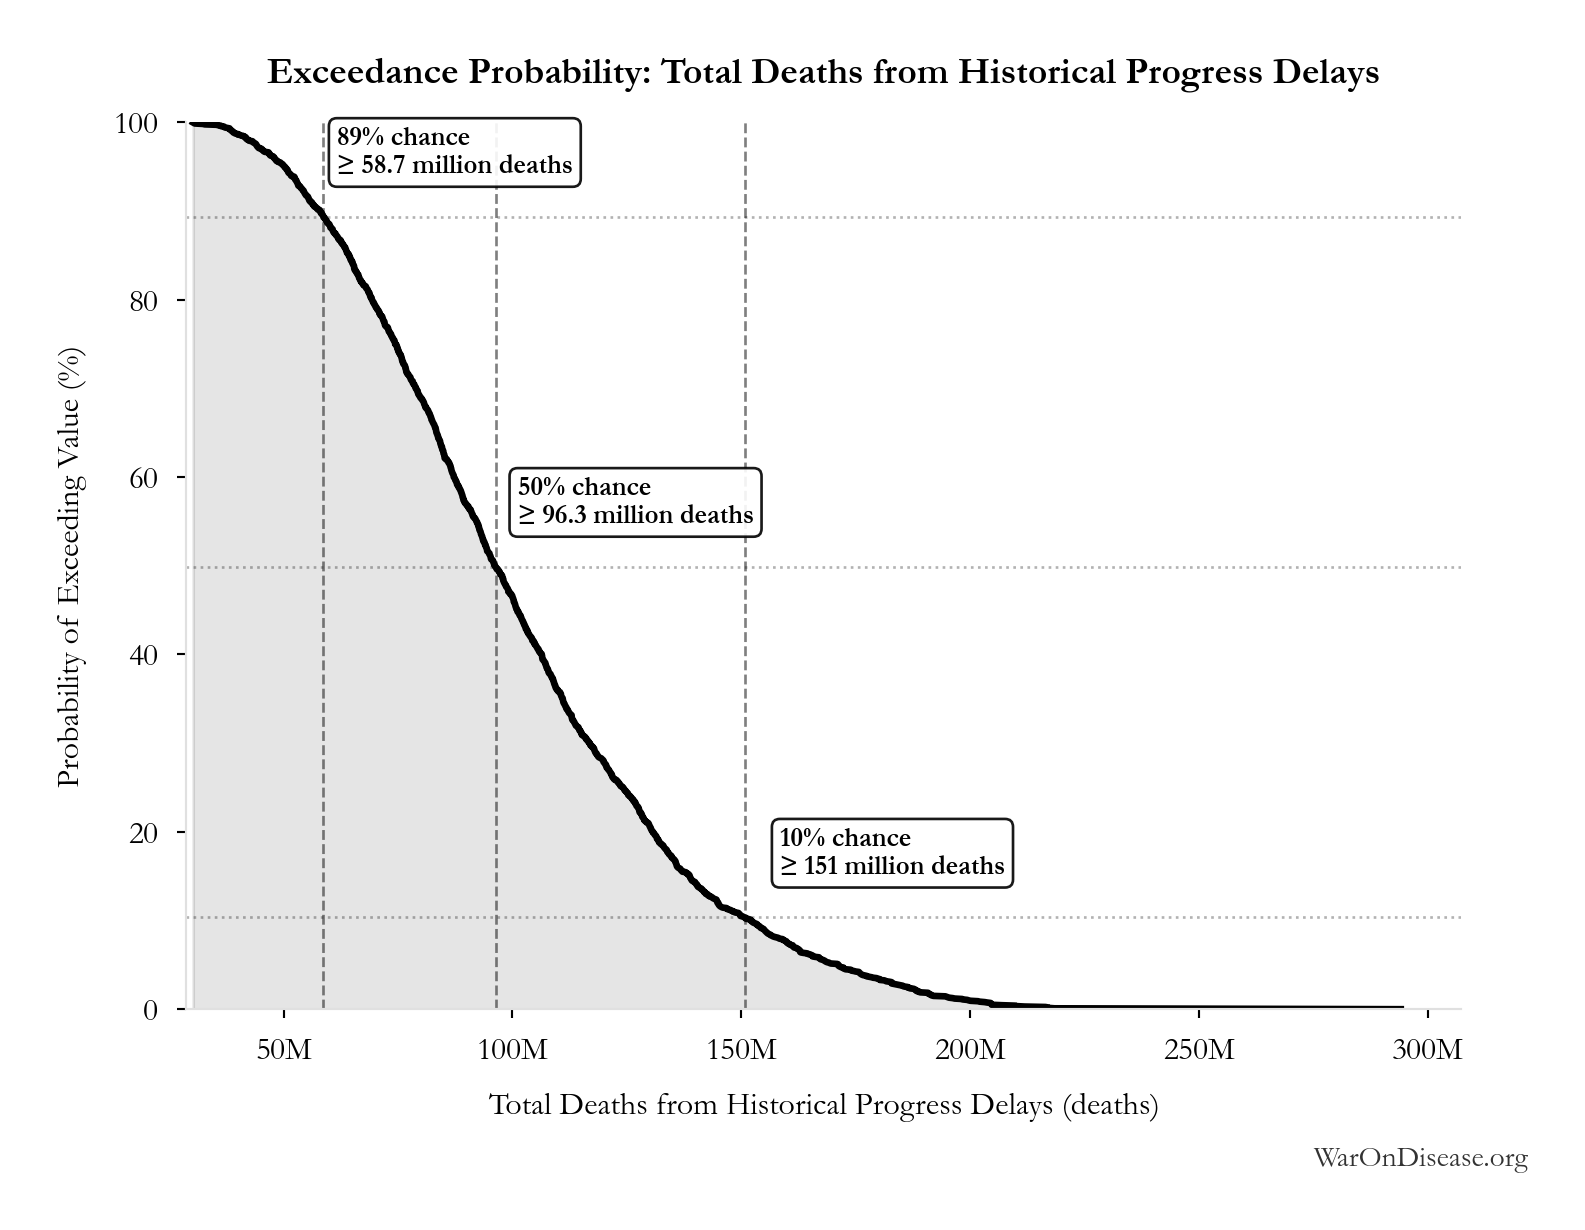
This exceedance probability chart shows the likelihood that Total Deaths from Historical Progress Delays will exceed any given threshold. Higher curves indicate more favorable outcomes with greater certainty.
Annual Lives Saved by Pharmaceuticals: 12.4 million deaths
Note📊 Details
Annual lives saved by pharmaceutical interventions globally. Derived from Lichtenberg (2019) finding of 148.7M life-years saved, divided by assumed 12-year average life extension per beneficiary. Note: Life-years is the primary metric; lives is an approximation for intuitive communication.
Inputs:
- Annual Life-Years Saved by Pharmaceuticals 📊: 149 million life-years (95% CI: 79.4 million life-years - 240 million life-years)
- Average Life Extension per Beneficiary: 12 years (95% CI: 8 years - 18 years)
\[ \begin{gathered} Lives_{saved,annual} \\ = \frac{LY_{saved,annual}}{T_{ext}} \\ = \frac{149M}{12} \\ = 12.4M \end{gathered} \]
Methodology:7
? Low confidence
Sensitivity Analysis
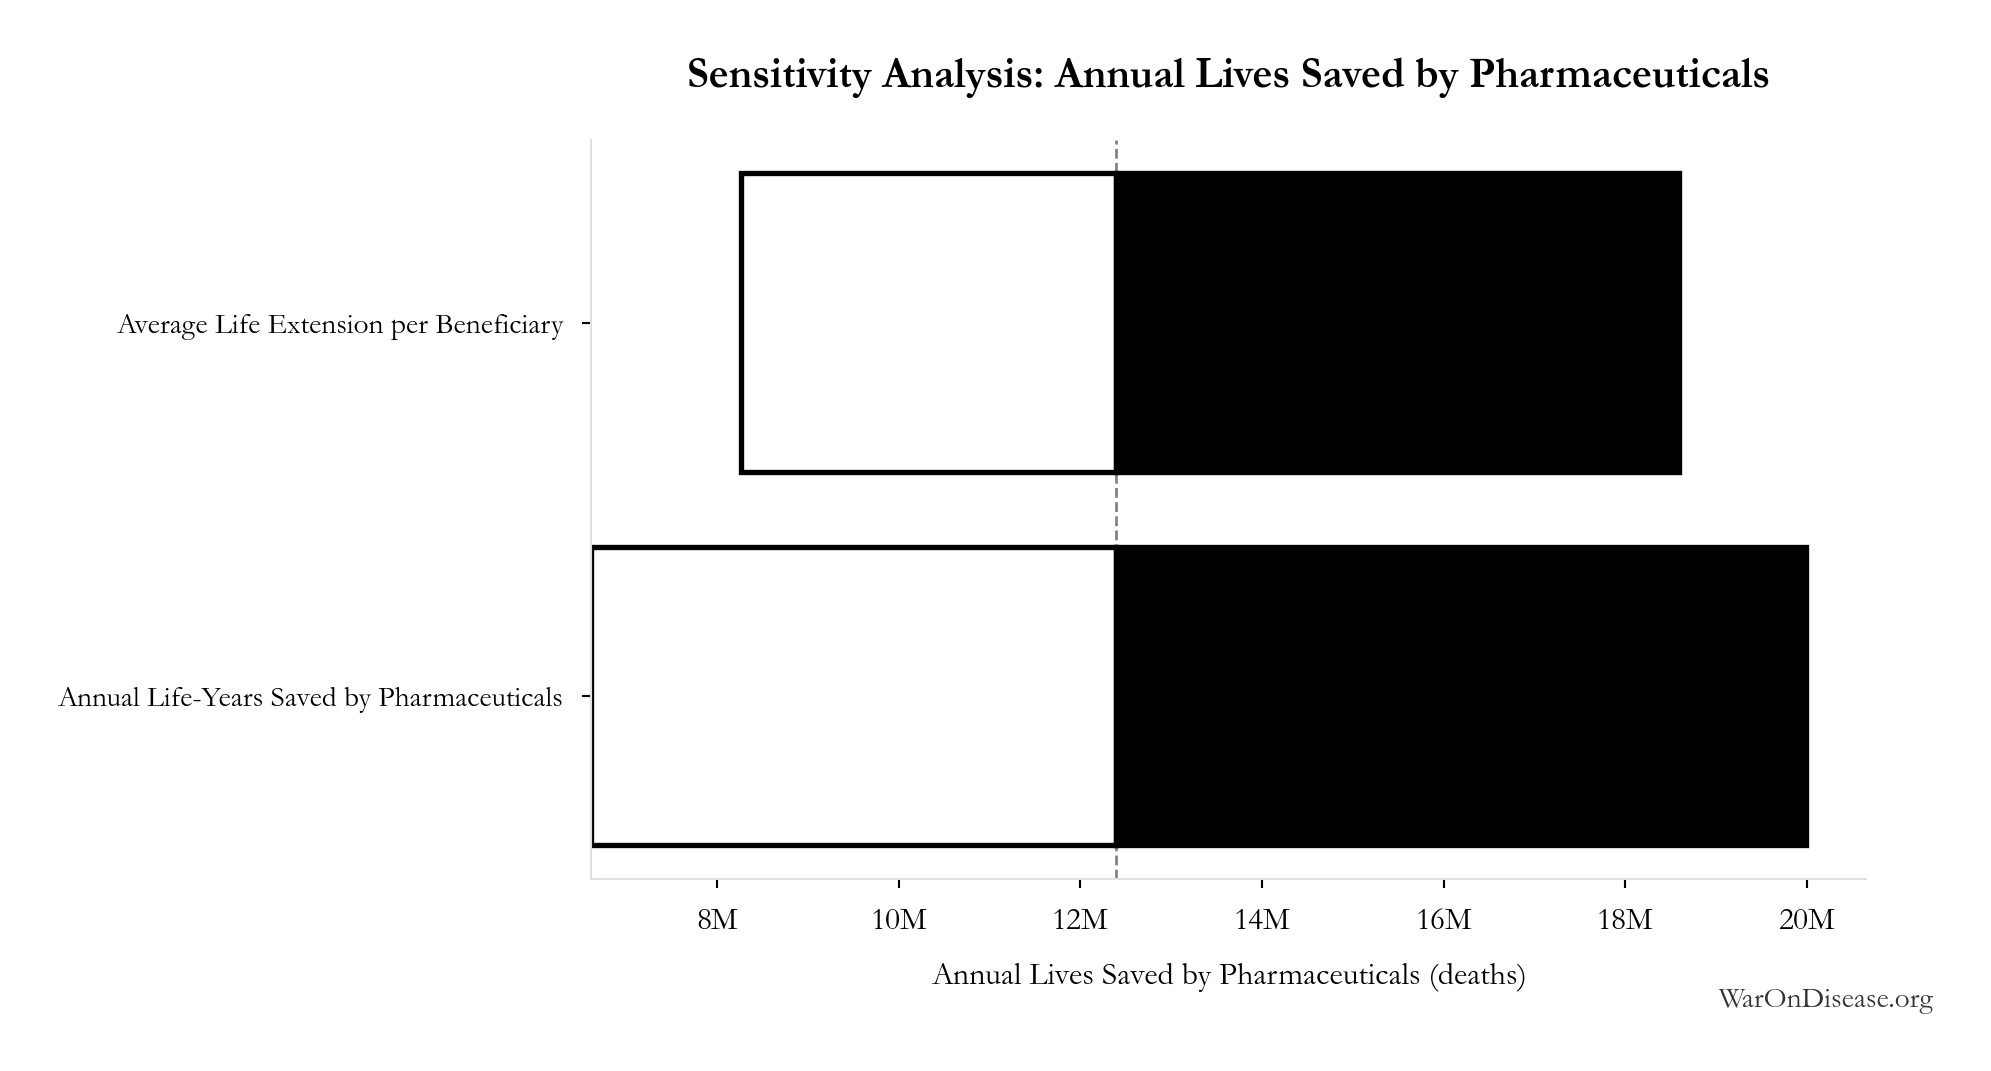
Sensitivity Indices for Annual Lives Saved by Pharmaceuticals
Regression-based sensitivity showing which inputs explain the most variance in the output.
| Input Parameter | Sensitivity Coefficient | Interpretation |
|---|---|---|
| Annual Life-Years Saved by Pharmaceuticals (life-years) | 1.0000 | Strong driver |
Interpretation: Standardized coefficients show the change in output (in SD units) per 1 SD change in input. Values near ±1 indicate strong influence; values exceeding ±1 may occur with correlated inputs.
Monte Carlo Distribution
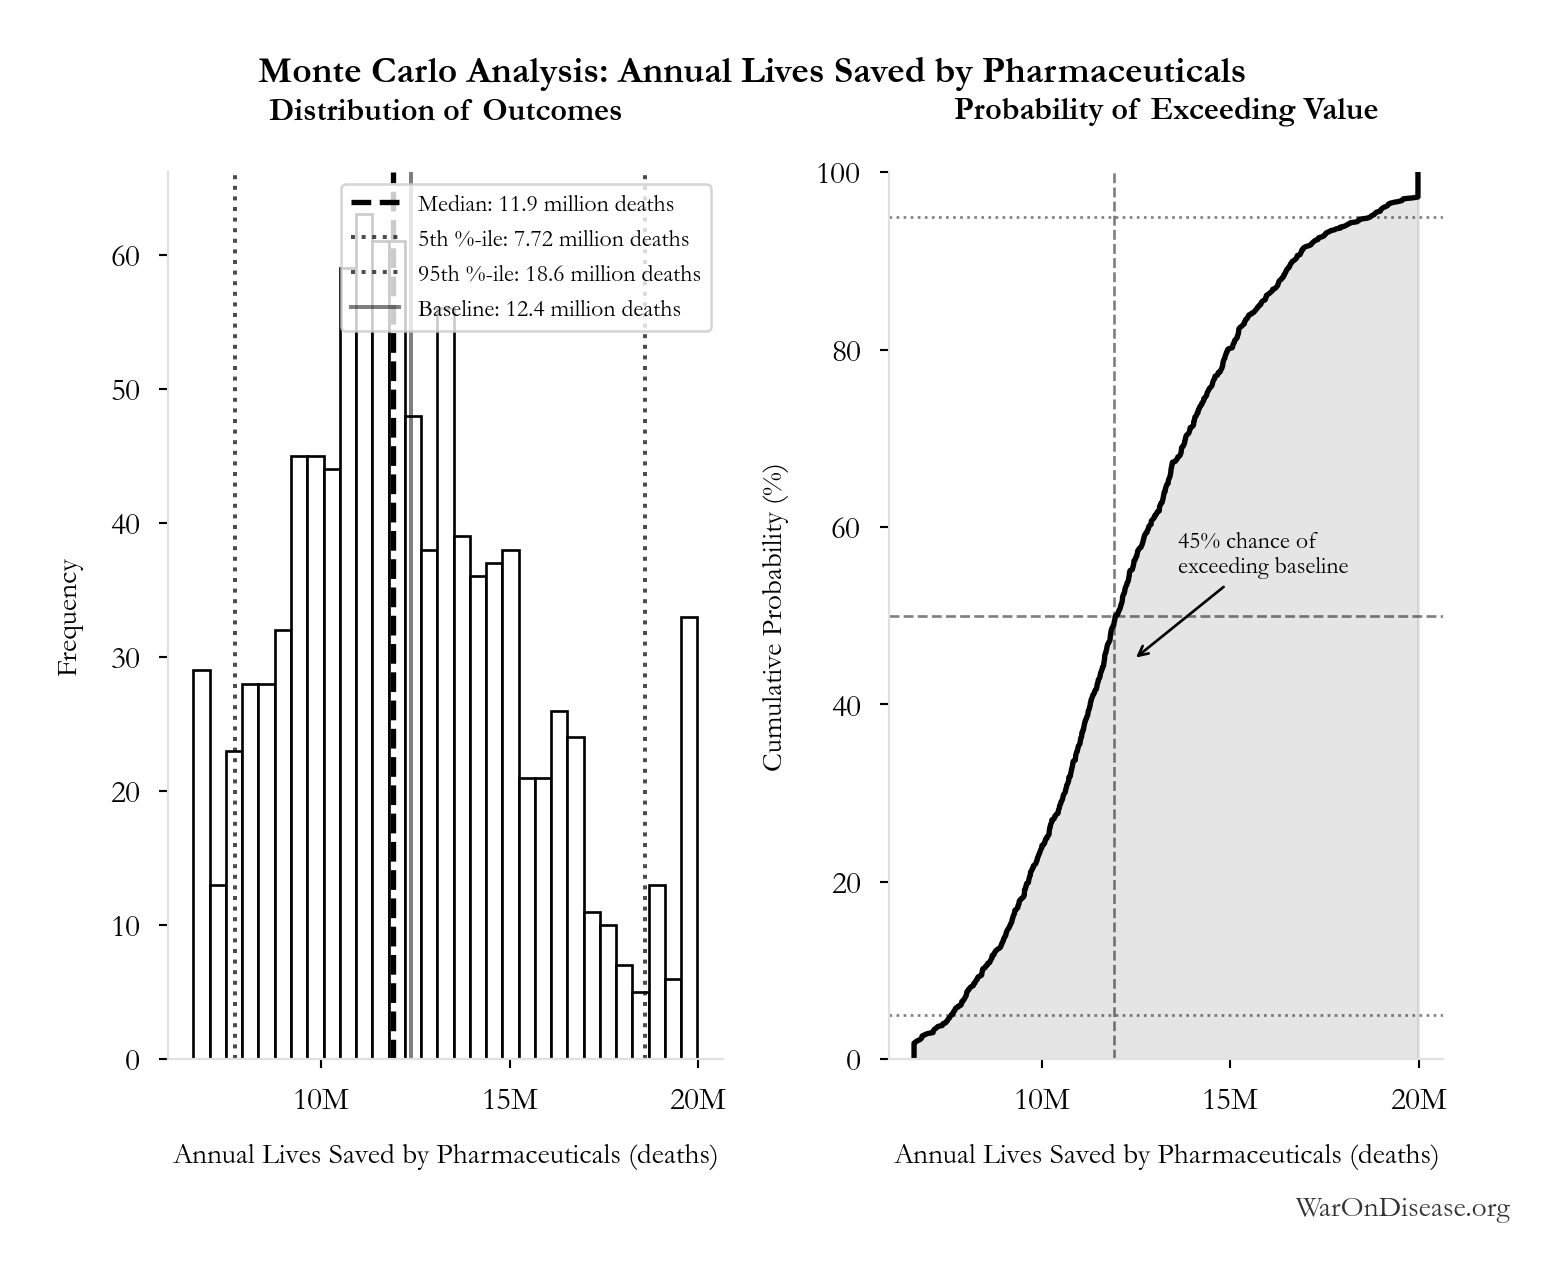
Simulation Results Summary: Annual Lives Saved by Pharmaceuticals
| Statistic | Value |
|---|---|
| Baseline (deterministic) | 12.4 million |
| Mean (expected value) | 12.3 million |
| Median (50th percentile) | 11.9 million |
| Standard Deviation | 3.17 million |
| 90% Range (5th-95th percentile) | [7.72 million, 18.6 million] |
The histogram shows the distribution of Annual Lives Saved by Pharmaceuticals across 10,000 Monte Carlo simulations. The CDF (right) shows the probability of the outcome exceeding any given value, which is useful for risk assessment.
Exceedance Probability
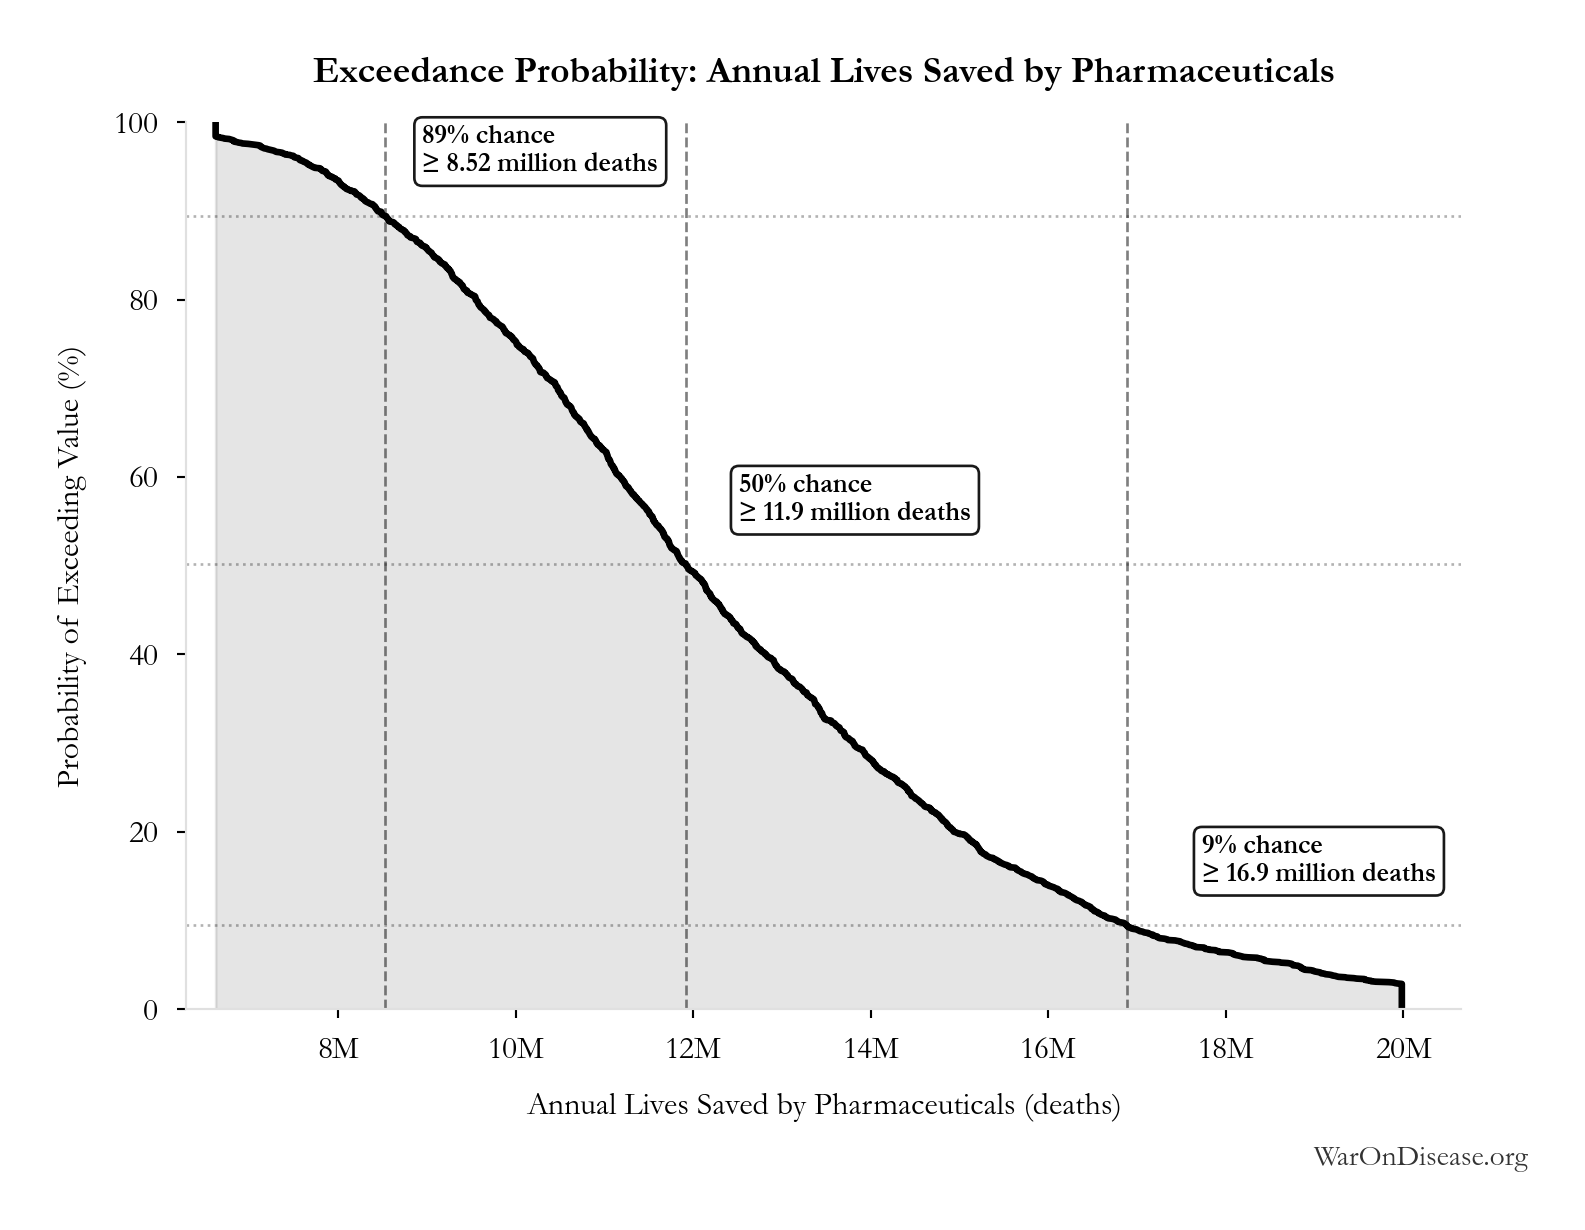
This exceedance probability chart shows the likelihood that Annual Lives Saved by Pharmaceuticals will exceed any given threshold. Higher curves indicate more favorable outcomes with greater certainty.
External Data Sources
Parameters sourced from peer-reviewed publications, institutional databases, and authoritative reports.
ADAPTABLE Trial Cost per Patient: $929
Note📊 Details
Cost per patient in ADAPTABLE trial ($14M PCORI grant / 15,076 patients). Note: This is the direct grant cost; true cost including in-kind may be 10-40% higher.
Source:1
Uncertainty Range
Technical: 95% CI: [$929, $1,400] • Distribution: Lognormal
What this means: There’s significant uncertainty here. The true value likely falls between $929 and $1,400 (±25%). This represents a wide range that our Monte Carlo simulations account for when calculating overall uncertainty in the results.
The lognormal distribution means values can’t go negative and have a longer tail toward higher values (common for costs and populations).
Input Distribution
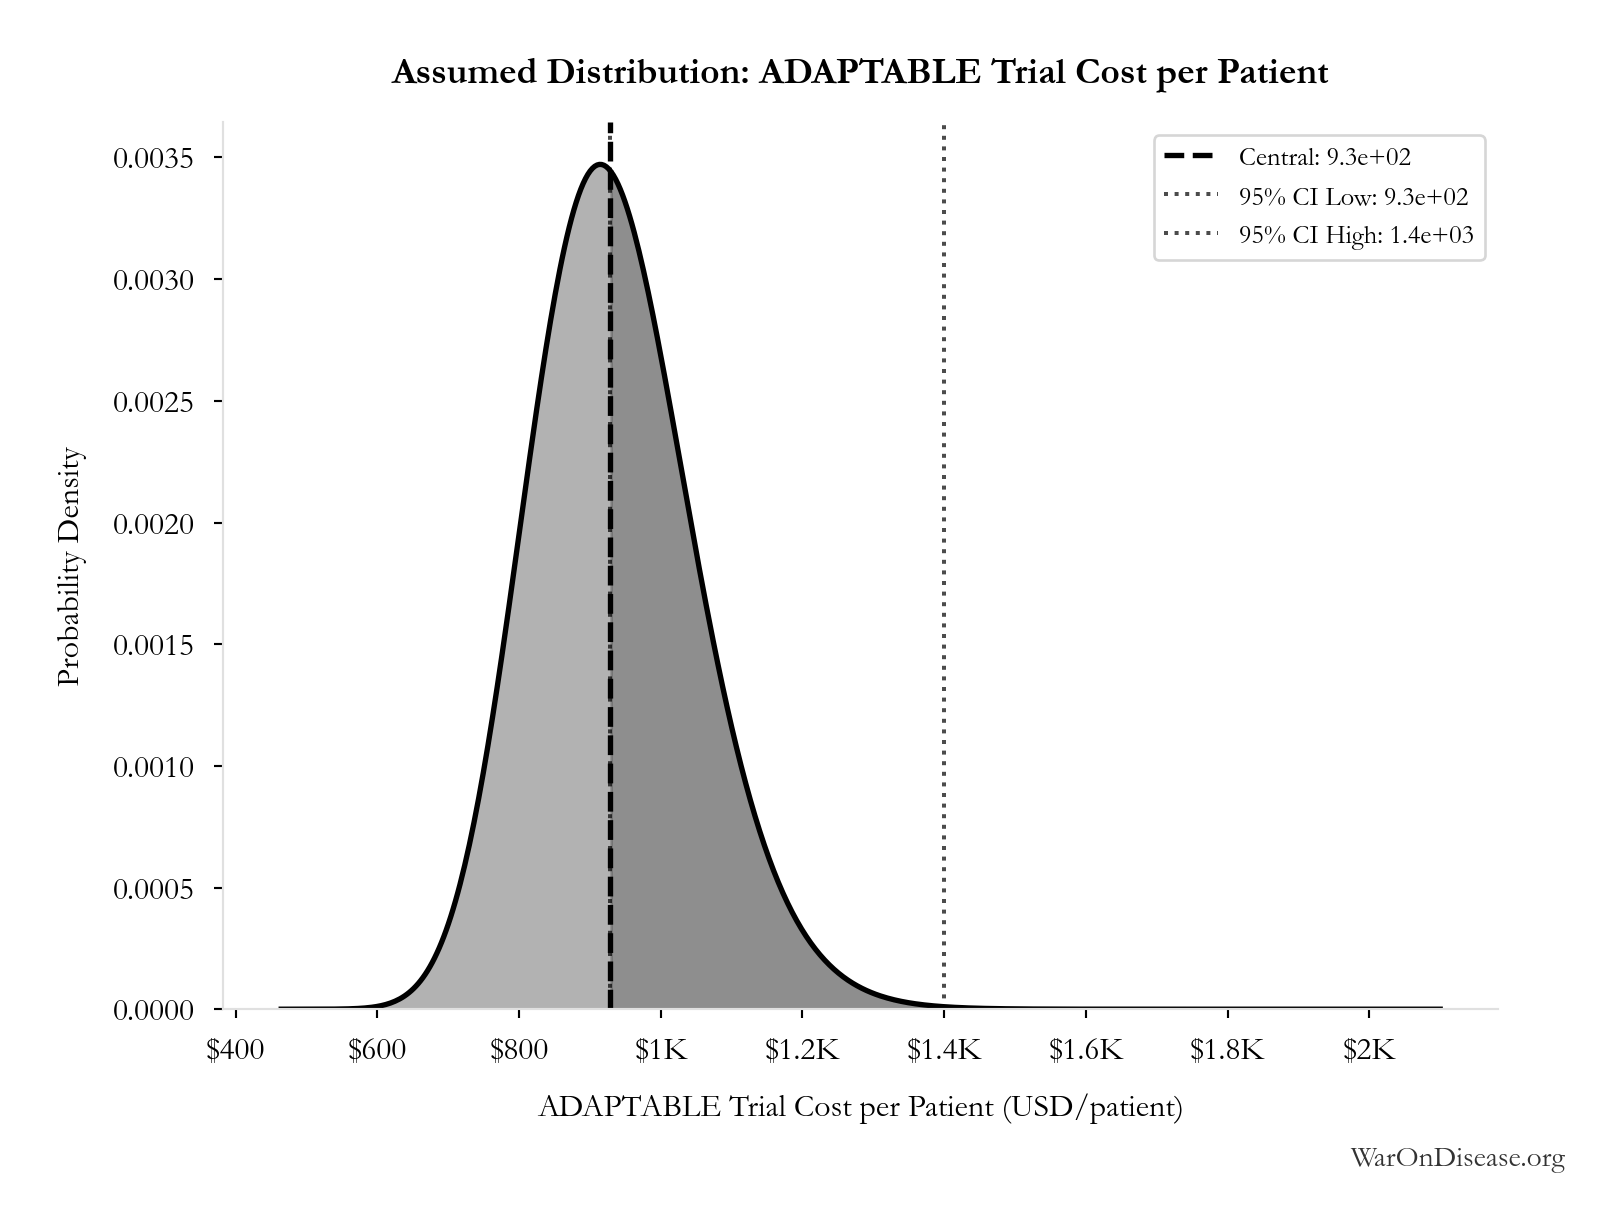
This chart shows the assumed probability distribution for this parameter. The shaded region represents the 95% confidence interval where we expect the true value to fall.
~ Medium confidence
Annual Global Clinical Trial Participants: 1.9 million patients/year
Note📊 Details
Annual global clinical trial participants (IQVIA 2022: 1.9M post-COVID normalization)
Source:2
Uncertainty Range
Technical: 95% CI: [1.5 million patients/year, 2.3 million patients/year] • Distribution: Lognormal
What this means: This estimate has moderate uncertainty. The true value likely falls between 1.5 million patients/year and 2.3 million patients/year (±21%). This represents a reasonable range that our Monte Carlo simulations account for when calculating overall uncertainty in the results.
The lognormal distribution means values can’t go negative and have a longer tail toward higher values (common for costs and populations).
Input Distribution
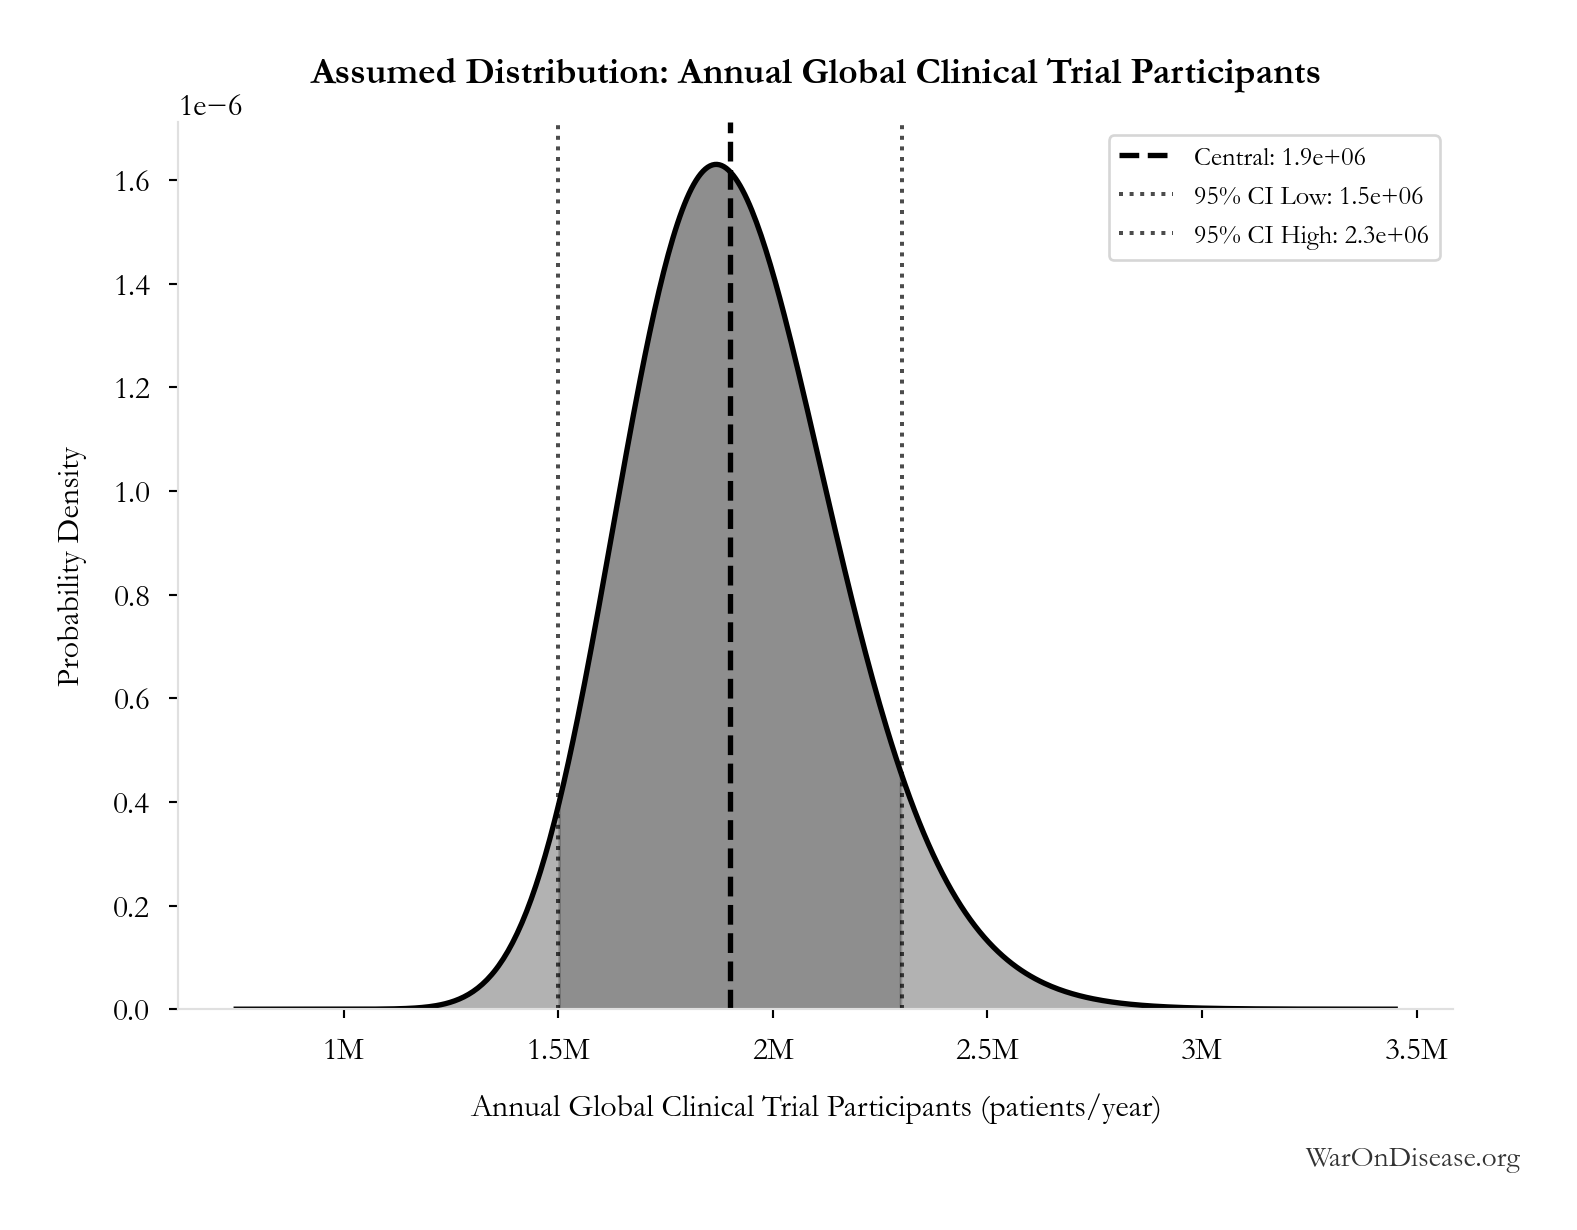
This chart shows the assumed probability distribution for this parameter. The shaded region represents the 95% confidence interval where we expect the true value to fall.
✓ High confidence
Pragmatic Trial Cost per Patient: $929
Note📊 Details
Embedded pragmatic trial cost per patient. Uses ADAPTABLE trial ($929) as DELIBERATELY CONSERVATIVE central estimate. Ramsberg & Platt (2018) reviewed 108 embedded pragmatic trials; 64 with cost data had median of only $97/patient - this estimate may overstate costs by 10x. Confidence interval spans meta-analysis median to complex chronic disease trials.
Source:1
Uncertainty Range
Technical: 95% CI: [$97, $3,000] • Distribution: Lognormal
What this means: This estimate is highly uncertain. The true value likely falls between $97 and $3,000 (±156%). This represents a very wide range that our Monte Carlo simulations account for when calculating overall uncertainty in the results.
The lognormal distribution means values can’t go negative and have a longer tail toward higher values (common for costs and populations).
Input Distribution
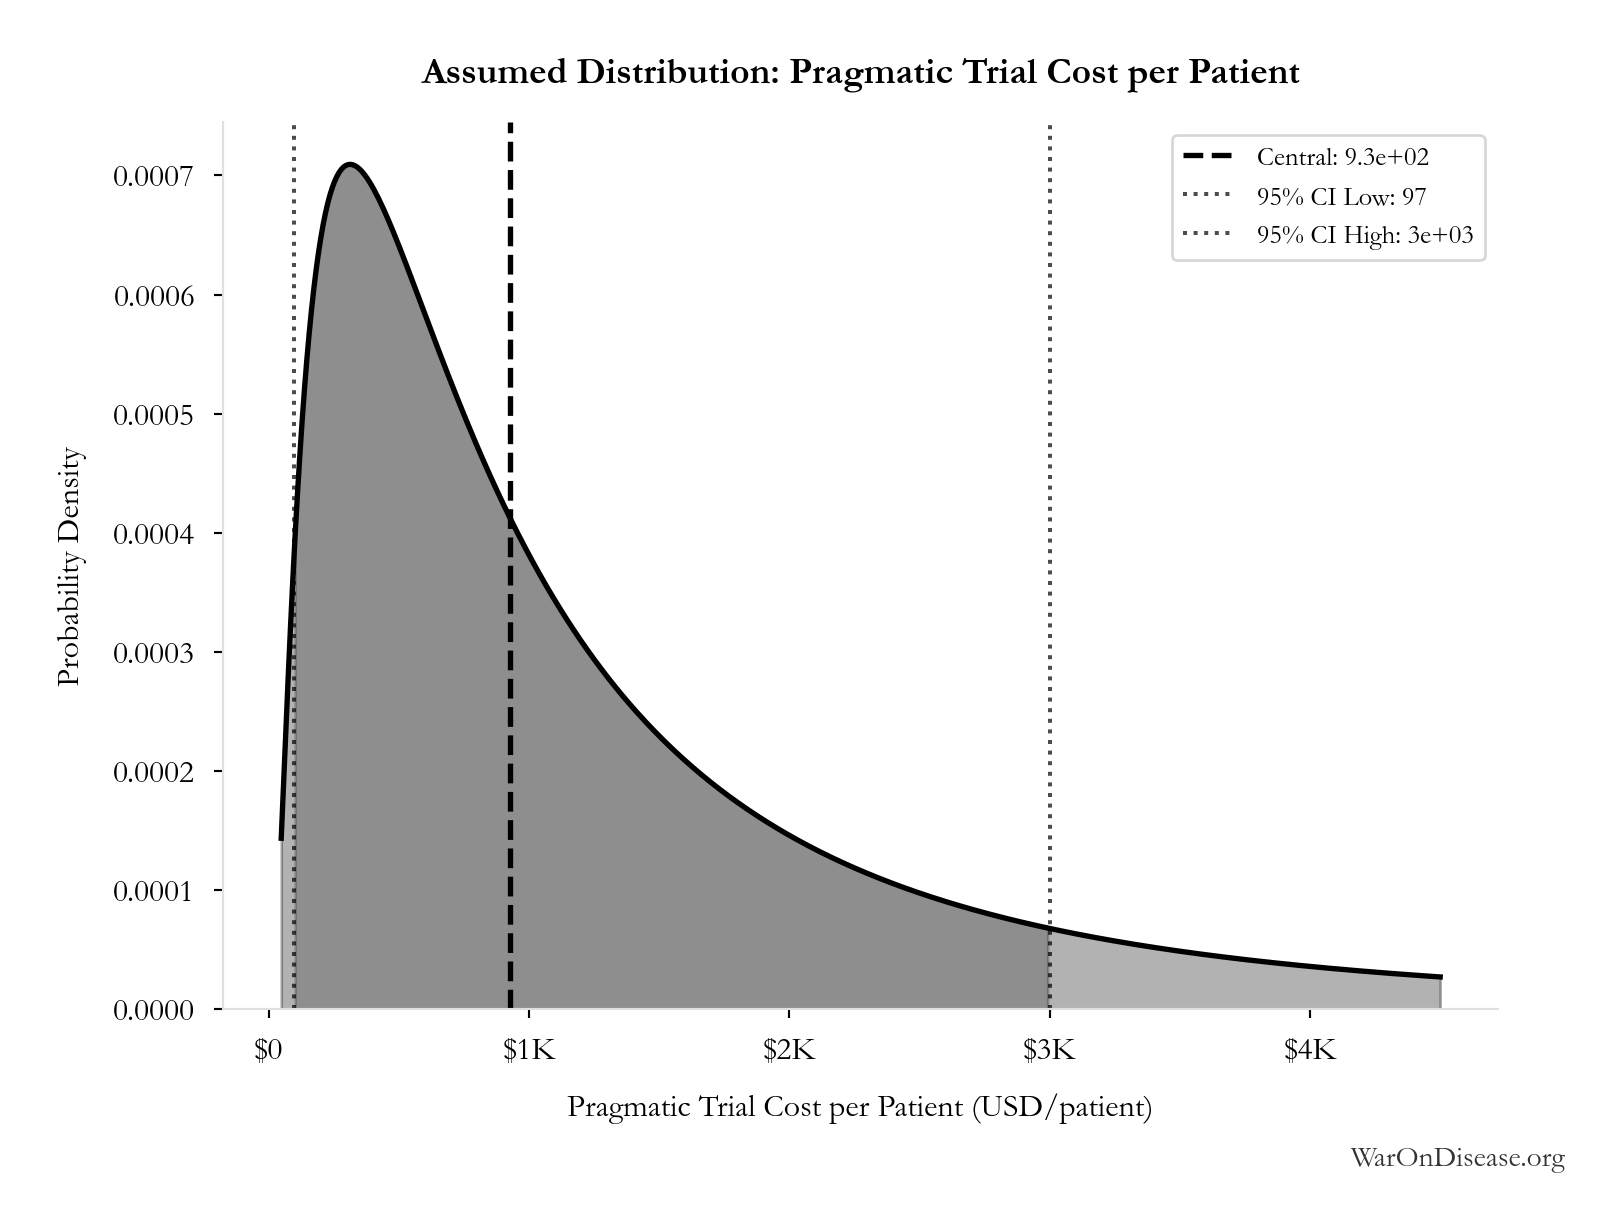
This chart shows the assumed probability distribution for this parameter. The shaded region represents the 95% confidence interval where we expect the true value to fall.
~ Medium confidence
Regulatory Delay for Efficacy Testing Post-Safety Verification: 8.2 years
Note📊 Details
Regulatory delay for efficacy testing (Phase II/III) post-safety verification. Based on BIO 2021 industry survey. Note: This is for drugs that COMPLETE the pipeline - survivor bias means actual delay for any given disease may be longer if candidates fail and must restart.
Source:3
Uncertainty Range
Technical: Distribution: Normal (SE: 2 years)
Input Distribution
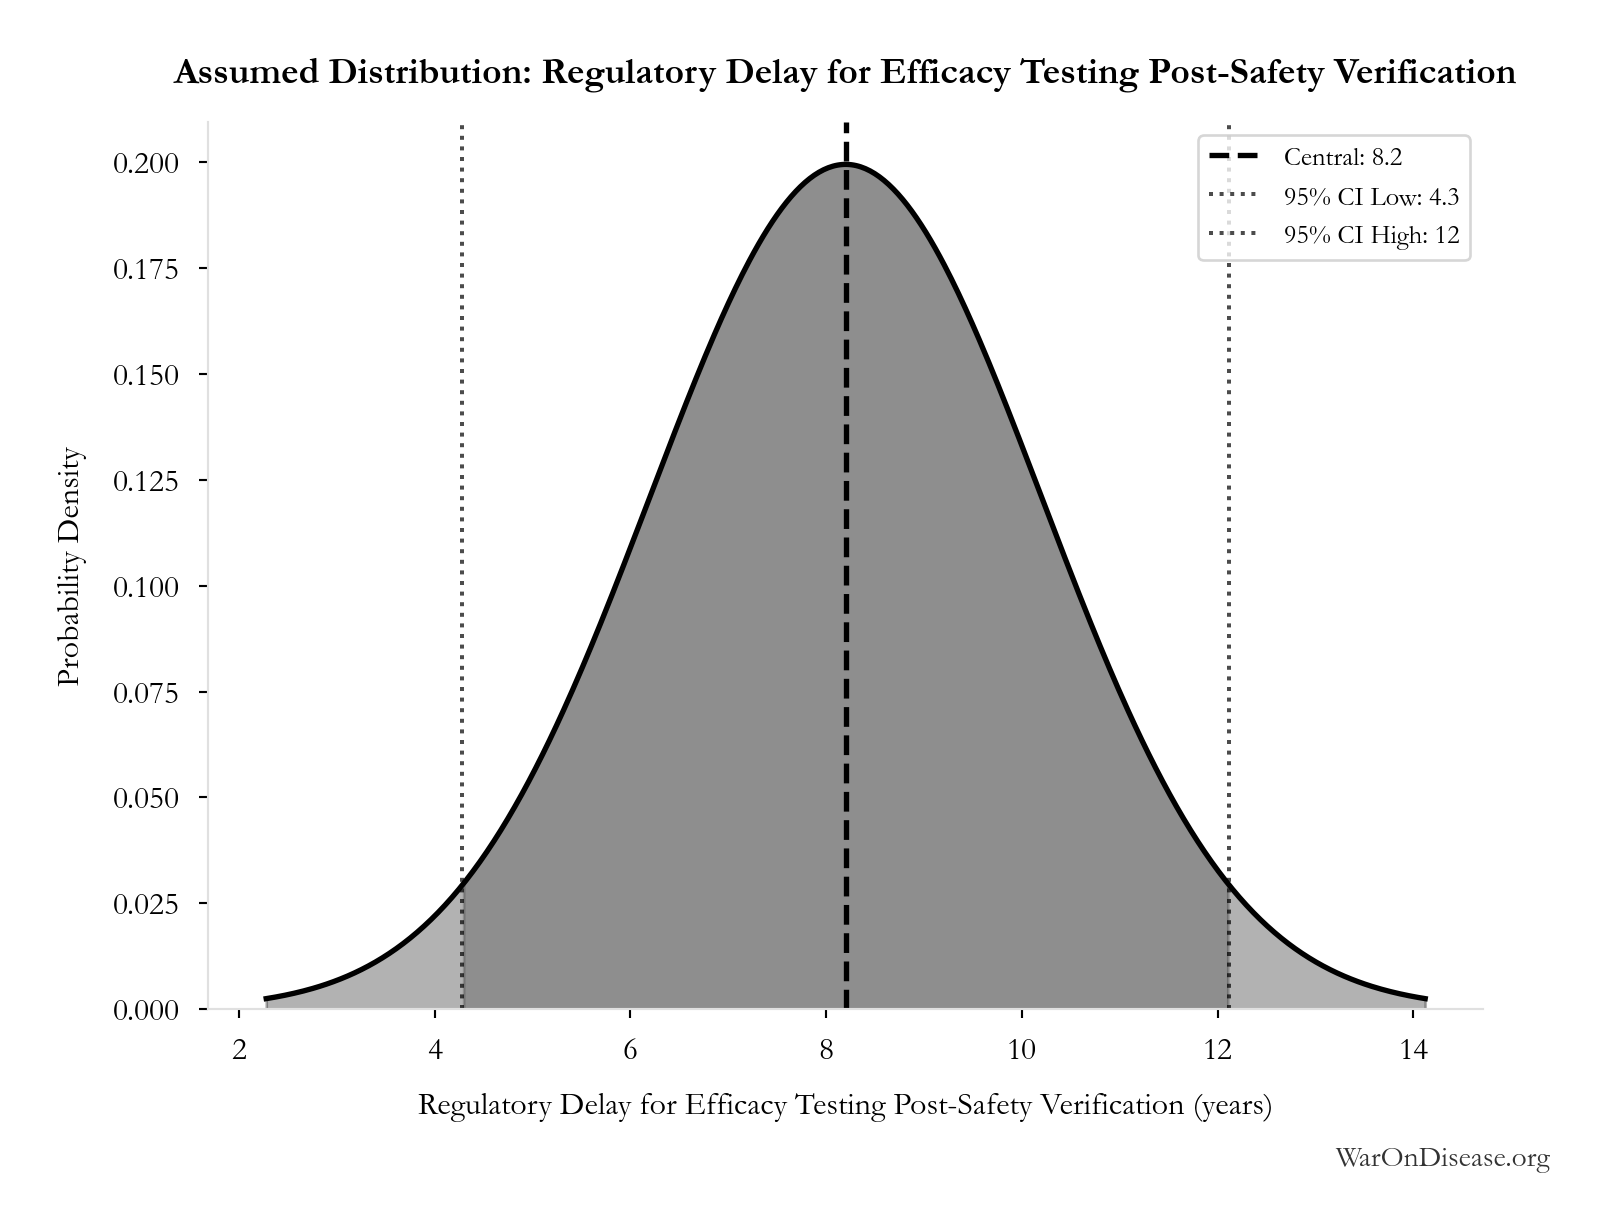
This chart shows the assumed probability distribution for this parameter. The shaded region represents the 95% confidence interval where we expect the true value to fall.
~ Medium confidence • 📊 Peer-reviewed • Updated 2021
Annual Deaths from All Diseases and Aging Globally: 55 million deaths/year
Note📊 Details
Annual deaths from all diseases and aging globally
Source:8
Uncertainty Range
Technical: Distribution: Normal (SE: 5 million deaths/year)
Input Distribution
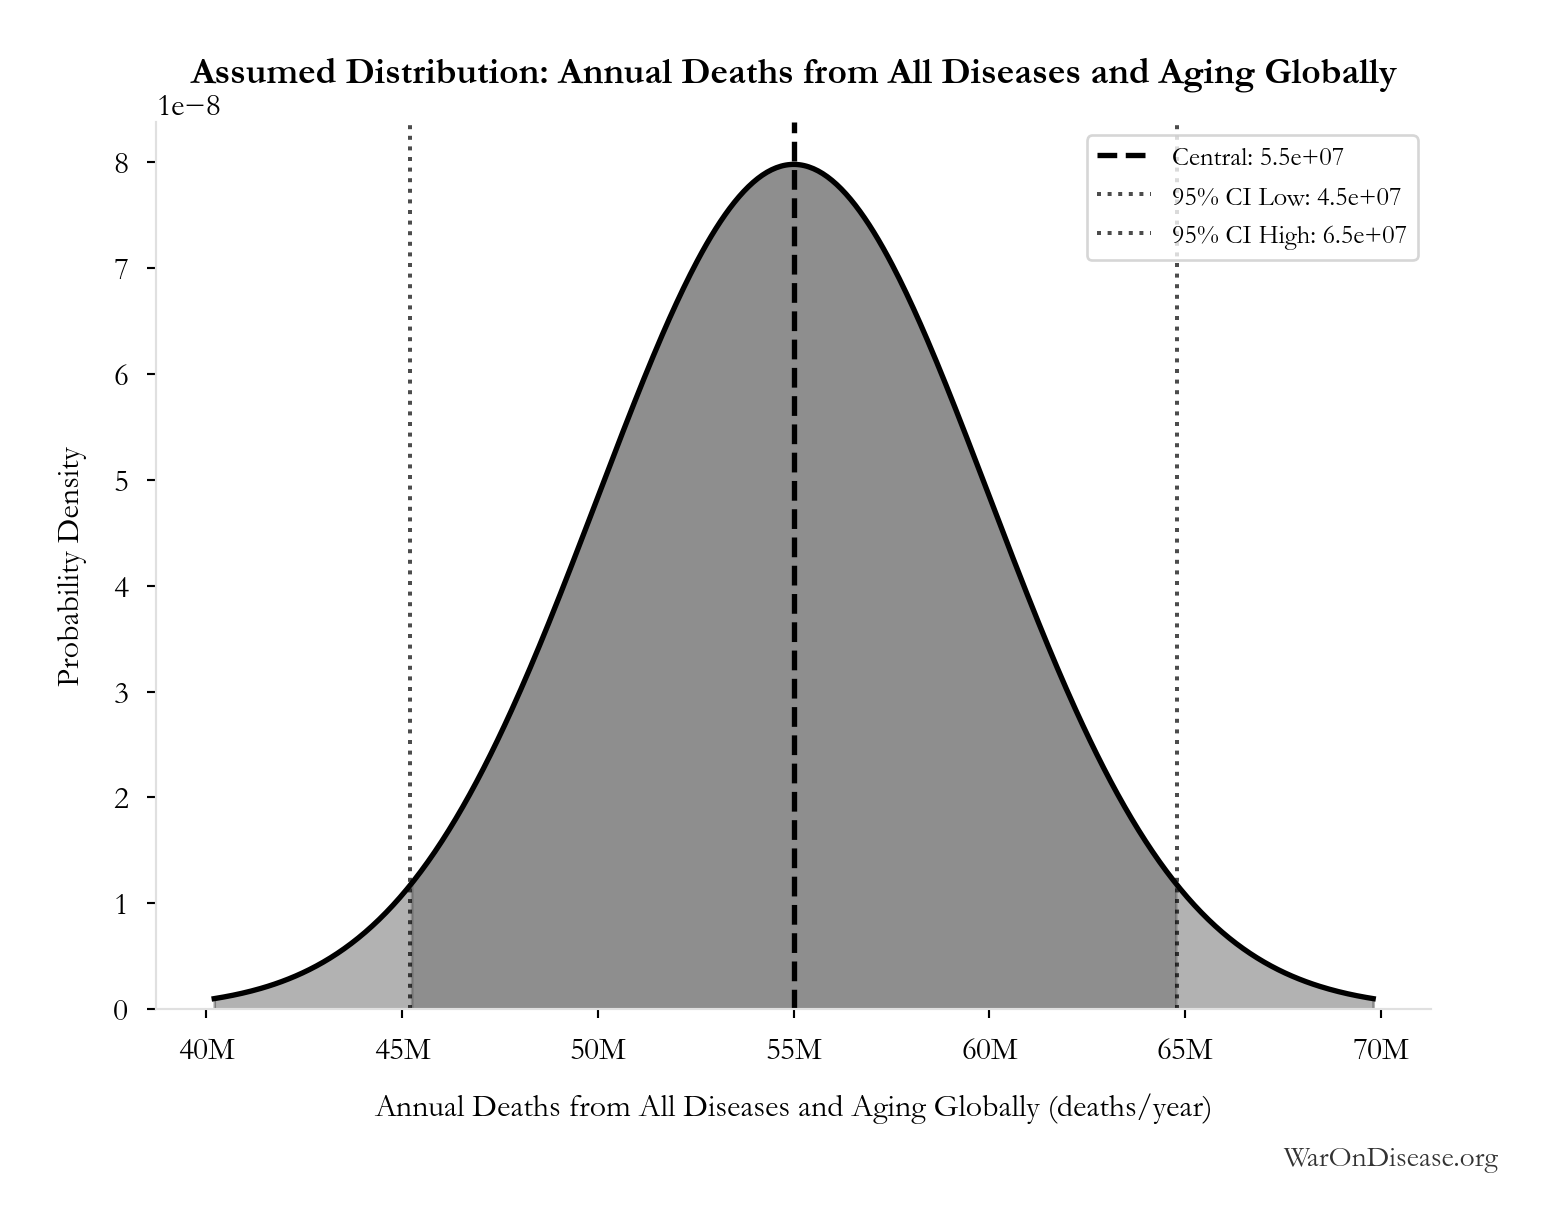
This chart shows the assumed probability distribution for this parameter. The shaded region represents the 95% confidence interval where we expect the true value to fall.
✓ High confidence
Annual Life-Years Saved by Pharmaceuticals: 149 million life-years
Note📊 Details
Annual life-years saved by pharmaceutical innovations globally. Lichtenberg (2019, NBER WP 25483) found that drugs launched after 1981 saved 148.7M life-years in 2013 across 22 countries using 3-way fixed-effects regression (disease-country-year). 95% CI [79.4M, 239.8M] propagated from Table 2 regression standard errors (β₀₋₁₁=-0.031±0.008, β₁₂₊=-0.057±0.013).
Source:7
Uncertainty Range
Technical: 95% CI: [79.4 million life-years, 240 million life-years] • Distribution: Lognormal
What this means: This estimate is highly uncertain. The true value likely falls between 79.4 million life-years and 240 million life-years (±54%). This represents a very wide range that our Monte Carlo simulations account for when calculating overall uncertainty in the results.
The lognormal distribution means values can’t go negative and have a longer tail toward higher values (common for costs and populations).
Input Distribution
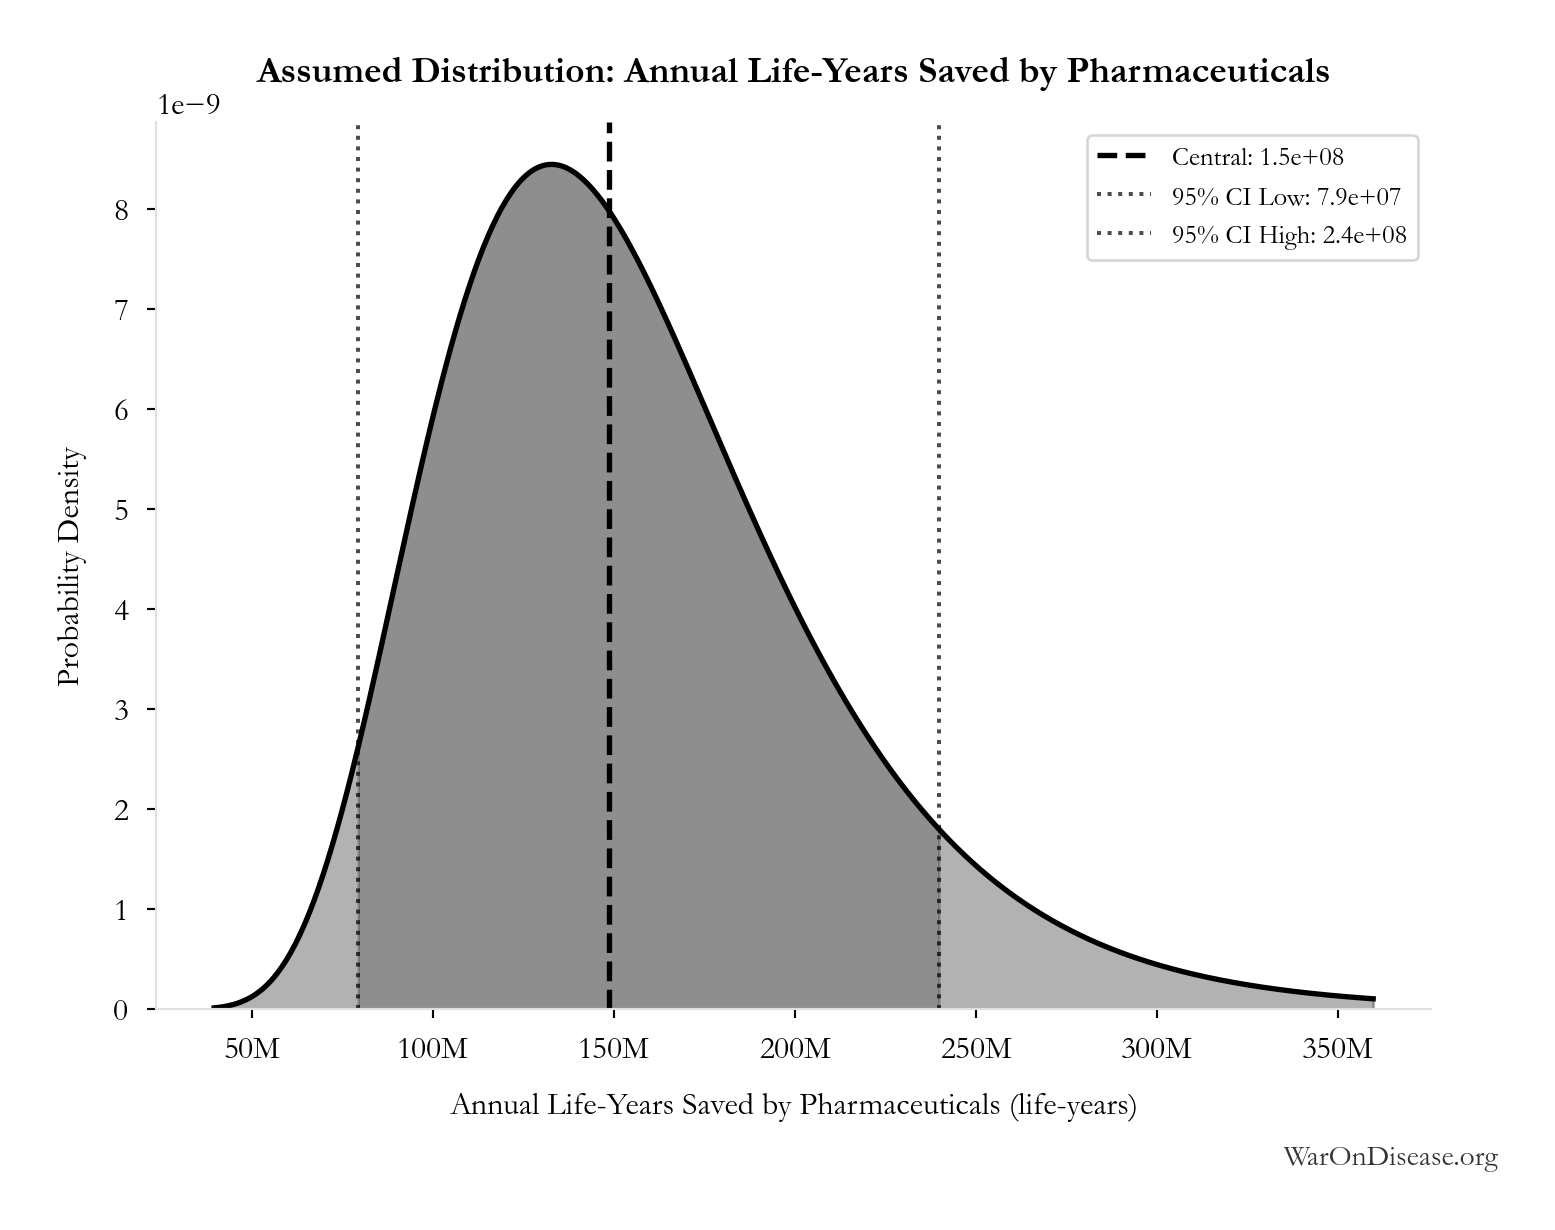
This chart shows the assumed probability distribution for this parameter. The shaded region represents the 95% confidence interval where we expect the true value to fall.
~ Medium confidence
Phase 3 Trial Total Cost (Minimum): $20 million
Note📊 Details
RECOVERY Trial Global Lives Saved: 1 million lives
Note📊 Details
Estimated lives saved globally by RECOVERY trial’s dexamethasone discovery. NHS England estimate (March 2021). Based on Águas et al. Nature Communications 2021 methodology applying RECOVERY trial mortality reductions (36% ventilated, 18% oxygen) to global COVID hospitalizations. Wide uncertainty range reflects extrapolation assumptions.
Source:5
Uncertainty Range
Technical: 95% CI: [500 thousand lives, 2 million lives] • Distribution: Lognormal
What this means: This estimate is highly uncertain. The true value likely falls between 500 thousand lives and 2 million lives (±75%). This represents a very wide range that our Monte Carlo simulations account for when calculating overall uncertainty in the results.
The lognormal distribution means values can’t go negative and have a longer tail toward higher values (common for costs and populations).
Input Distribution
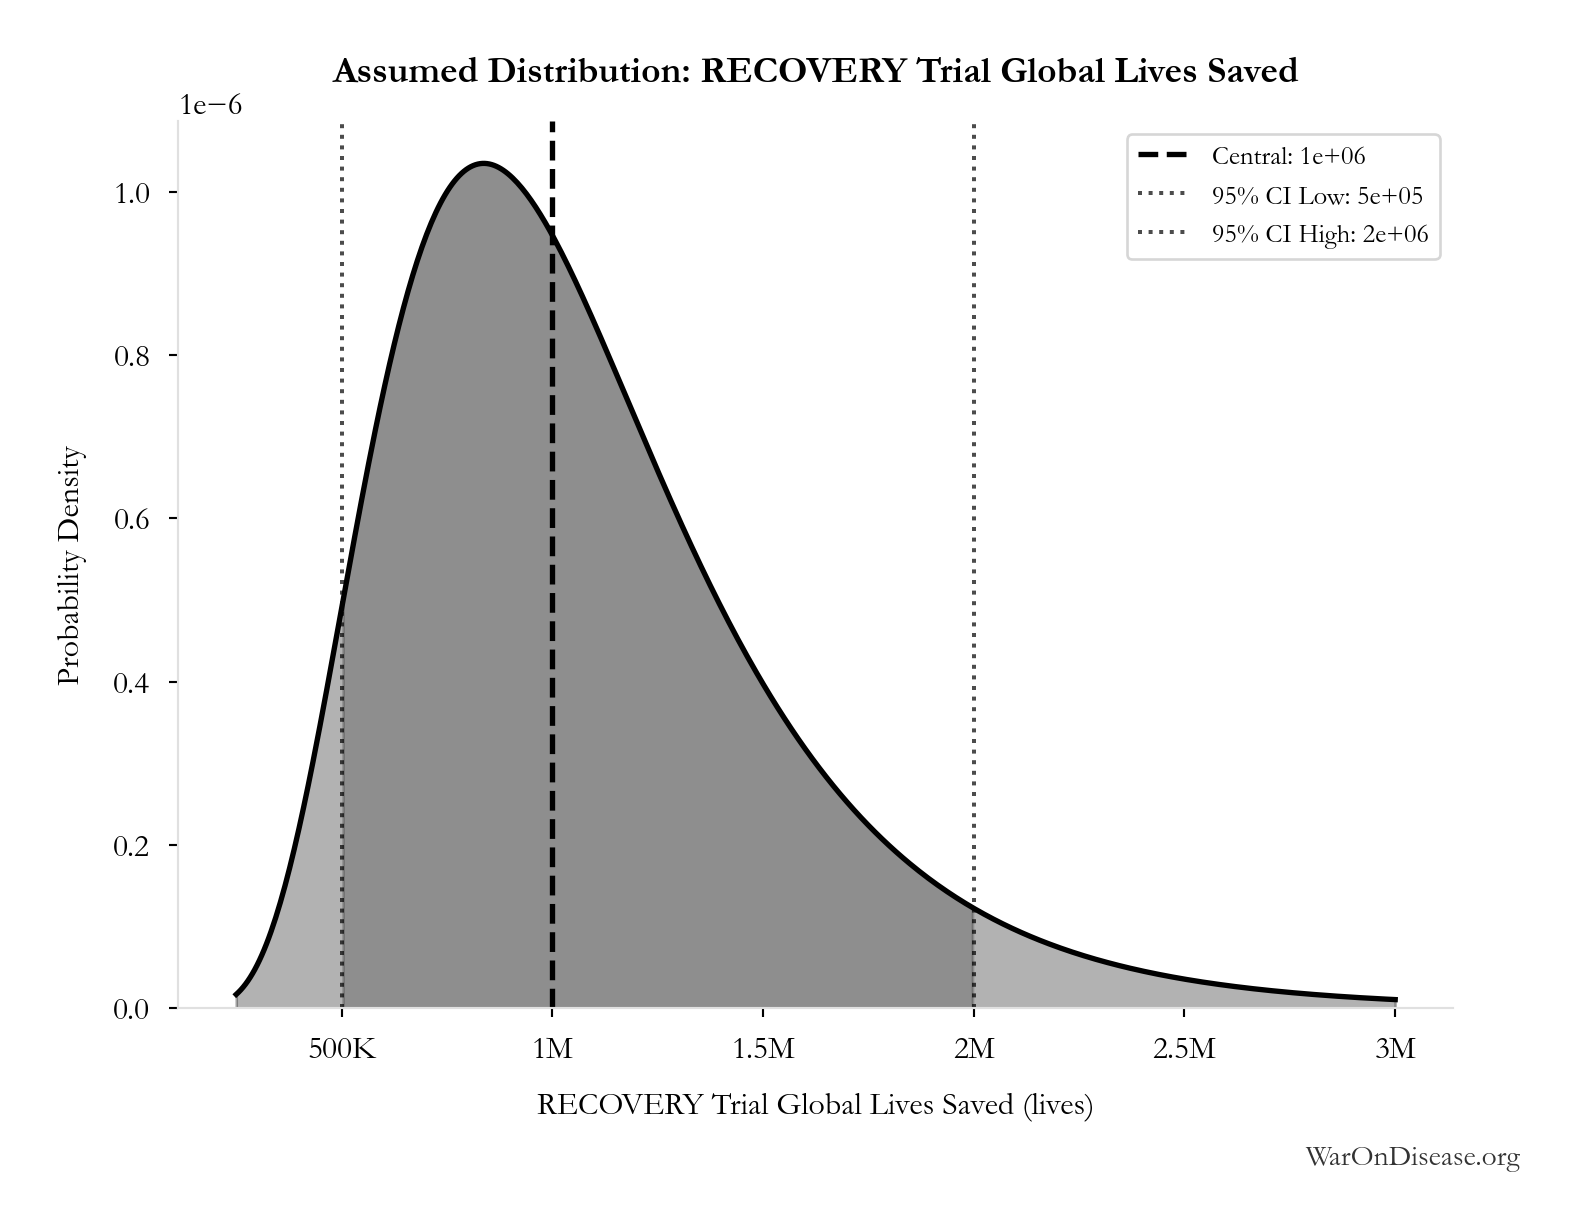
This chart shows the assumed probability distribution for this parameter. The shaded region represents the 95% confidence interval where we expect the true value to fall.
~ Medium confidence
Phase 3 Cost per Patient: $41,000
Note📊 Details
Phase 3 cost per patient (median from FDA study)
Source:6
Uncertainty Range
Technical: 95% CI: [$20,000, $120,000] • Distribution: Lognormal
What this means: This estimate is highly uncertain. The true value likely falls between $20,000 and $120,000 (±122%). This represents a very wide range that our Monte Carlo simulations account for when calculating overall uncertainty in the results.
The lognormal distribution means values can’t go negative and have a longer tail toward higher values (common for costs and populations).
Input Distribution
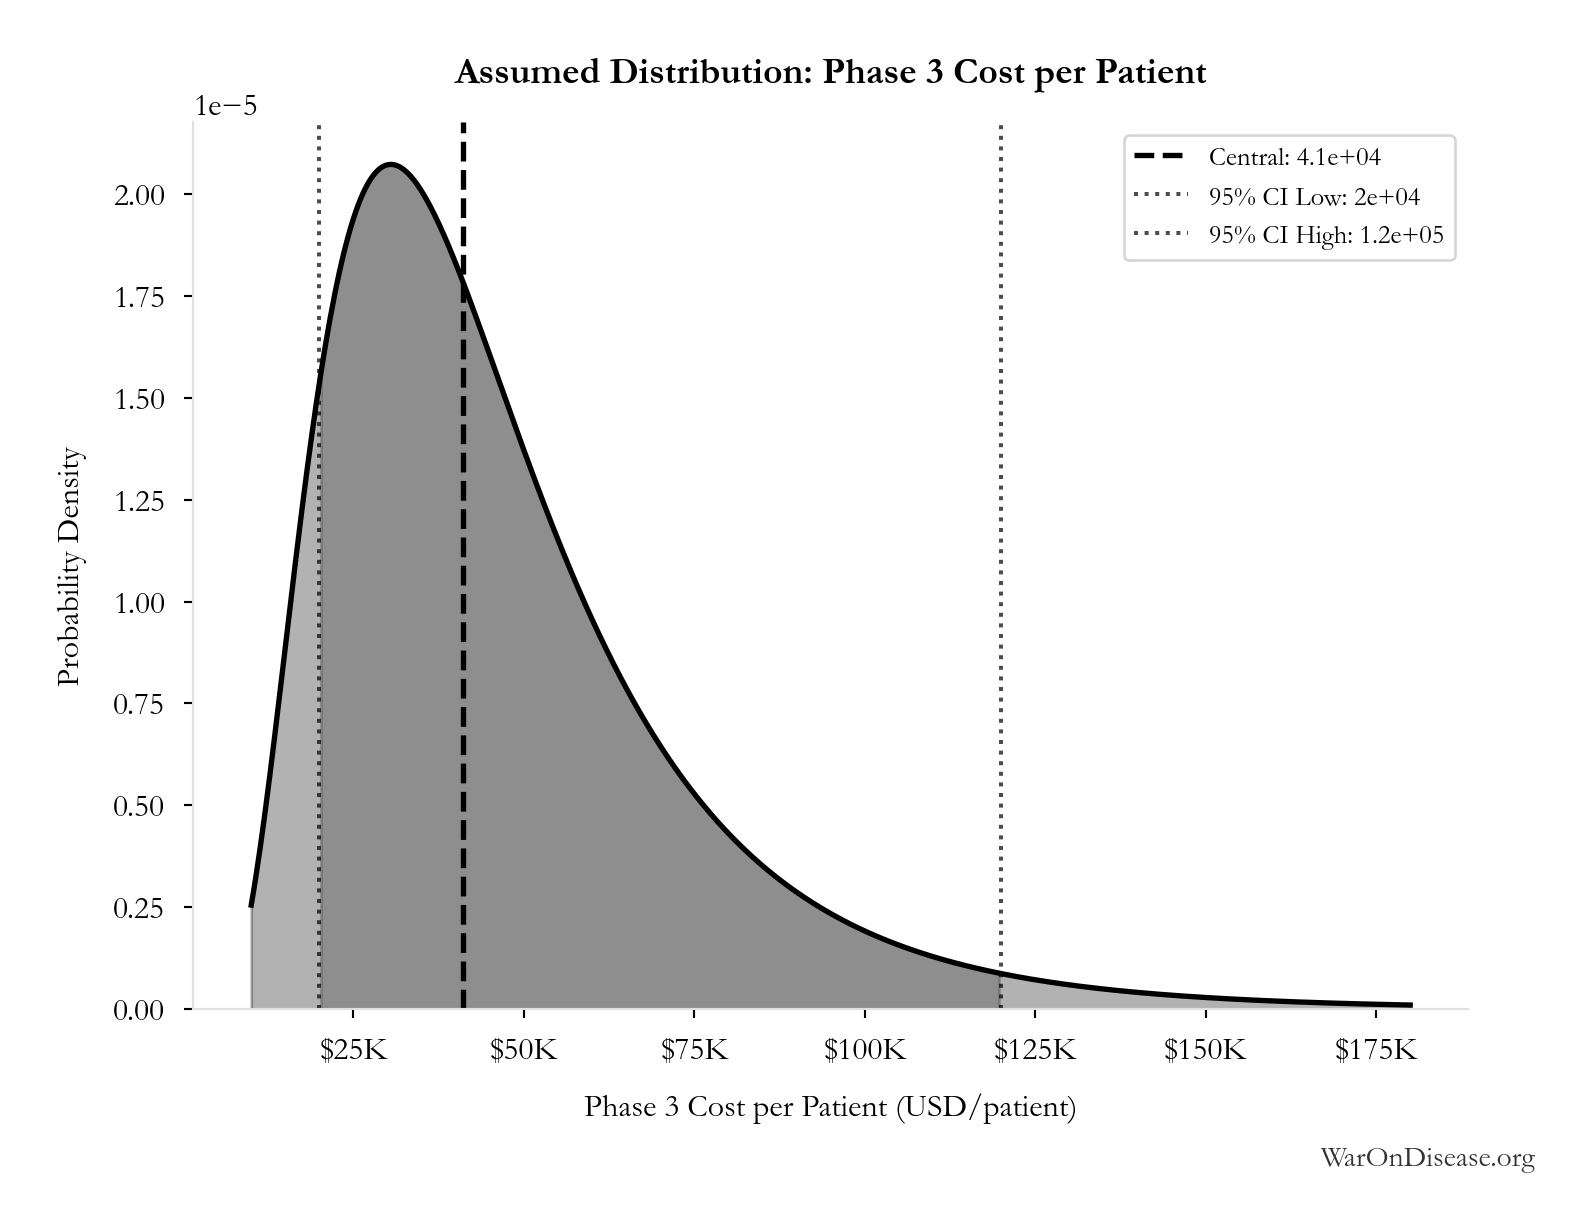
This chart shows the assumed probability distribution for this parameter. The shaded region represents the 95% confidence interval where we expect the true value to fall.
✓ High confidence
Core Definitions
Fundamental parameters and constants used throughout the analysis.
Average Life Extension per Beneficiary: 12 years
Note📊 Details
Average years of life extension per person saved by pharmaceutical interventions. Assumption used to convert life-years saved to approximate lives saved. Based on Lichtenberg’s methodology where life-years are calculated from Years of Life Lost (YLL) reductions.
Uncertainty Range
Technical: 95% CI: [8 years, 18 years] • Distribution: Triangular
What this means: There’s significant uncertainty here. The true value likely falls between 8 years and 18 years (±42%). This represents a wide range that our Monte Carlo simulations account for when calculating overall uncertainty in the results.
The triangular distribution means values cluster around a most-likely point but can range higher or lower.
Input Distribution
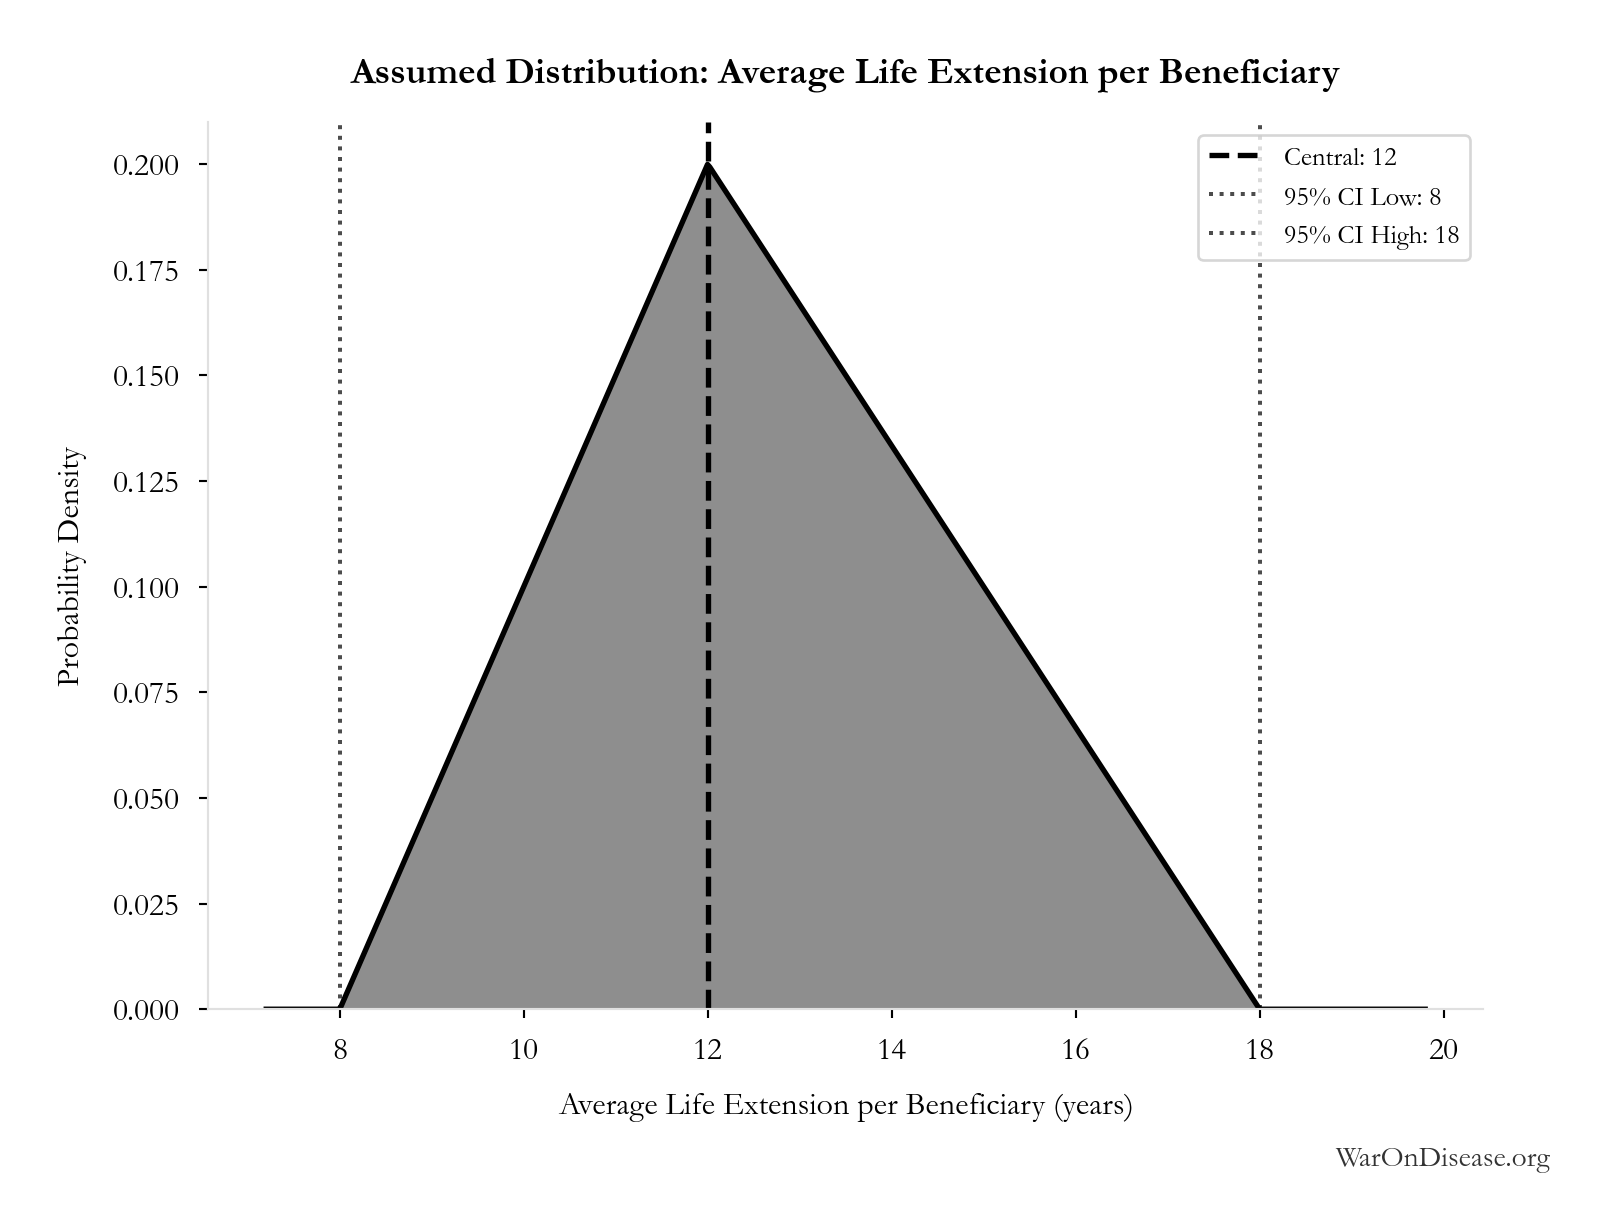
This chart shows the assumed probability distribution for this parameter. The shaded region represents the 95% confidence interval where we expect the true value to fall.
Core definition
Stage 1 Observational Analysis Cost per Patient: $0.1
Note📊 Details
Order-of-magnitude estimate for Stage 1 observational signal detection (PIS calculation). Validated by FDA Sentinel benchmark (~$1/patient/year for similar drug safety analysis at 100M+ scale). True cost varies with scale and complexity; exact value less important than order-of-magnitude difference vs pragmatic trials (~$500-929/patient) and traditional Phase 3 (~$41,000/patient).
Uncertainty Range
Technical: 95% CI: [$0.03, $1] • Distribution: Lognormal
What this means: This estimate is highly uncertain. The true value likely falls between $0.03 and $1 (±485%). This represents a very wide range that our Monte Carlo simulations account for when calculating overall uncertainty in the results.
The lognormal distribution means values can’t go negative and have a longer tail toward higher values (common for costs and populations).
Input Distribution
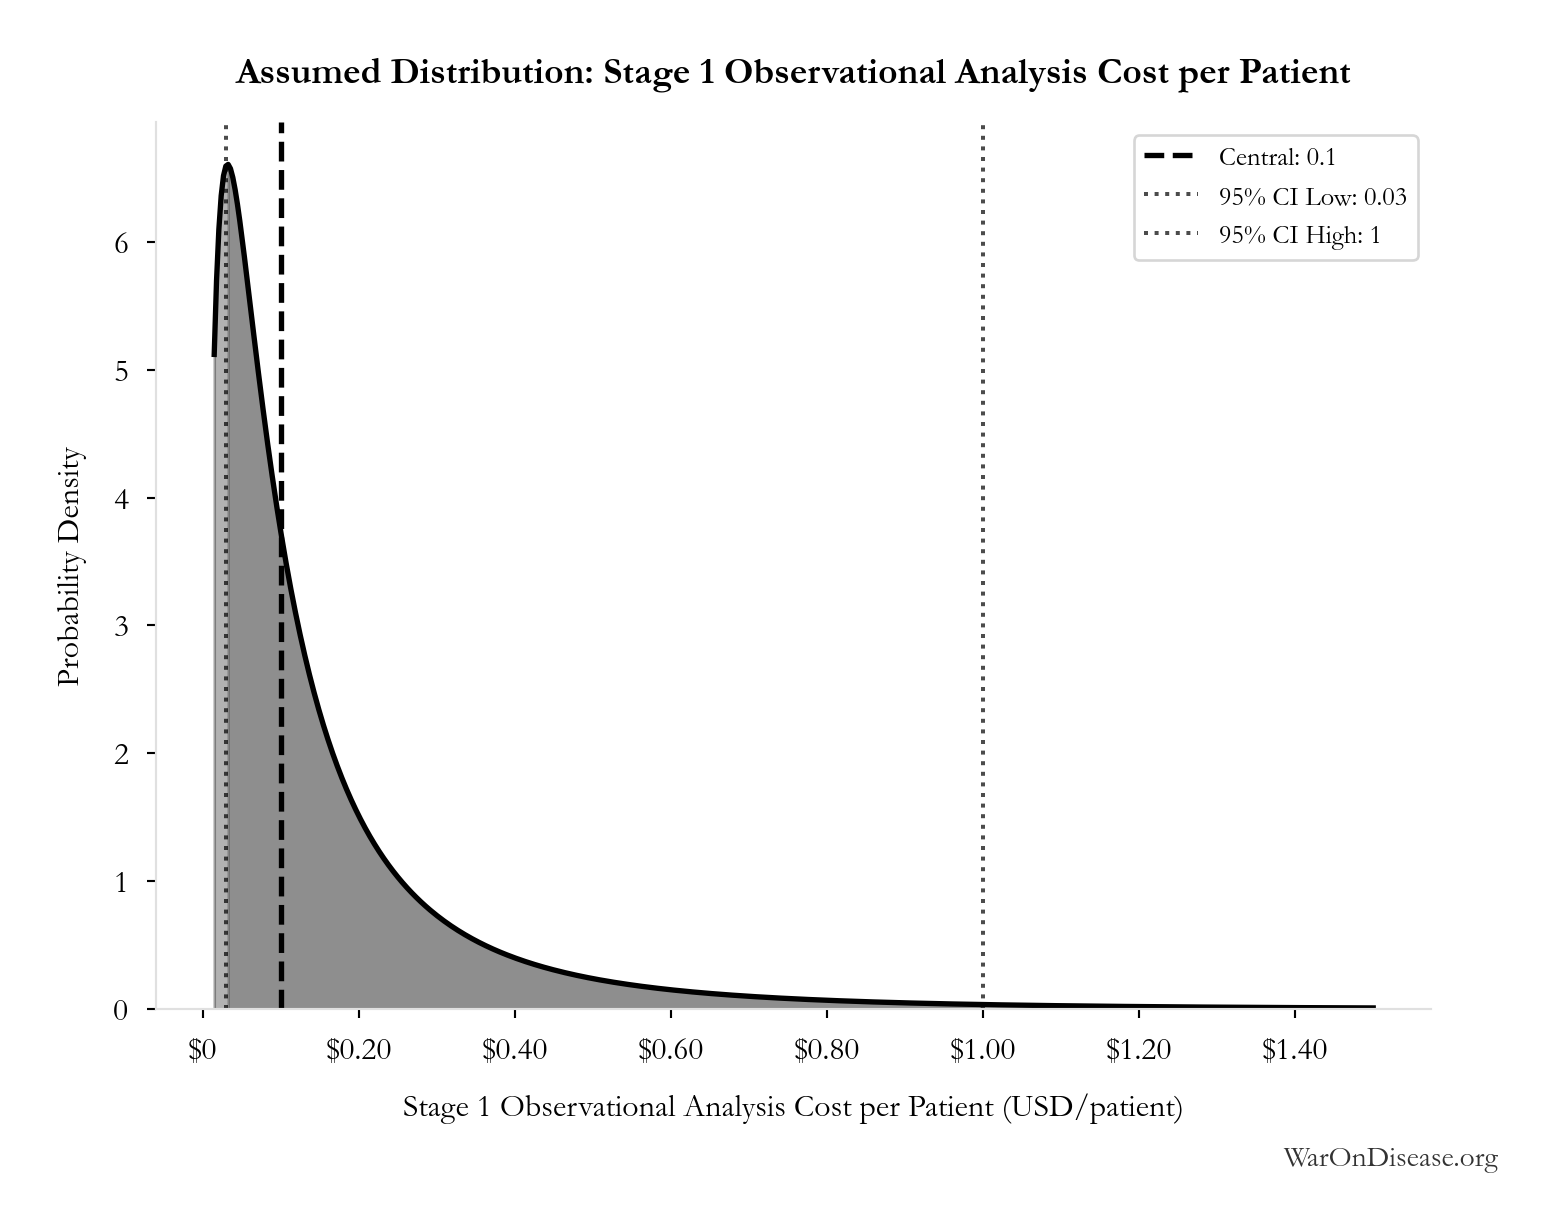
This chart shows the assumed probability distribution for this parameter. The shaded region represents the 95% confidence interval where we expect the true value to fall.
Core definition
References
1.
NIH Common Fund. NIH pragmatic trials: Minimal funding despite 30x cost advantage. NIH Common Fund: HCS Research Collaboratory https://commonfund.nih.gov/hcscollaboratory (2025)
The NIH Pragmatic Trials Collaboratory funds trials at $500K for planning phase, $1M/year for implementation-a tiny fraction of NIH’s budget. The ADAPTABLE trial cost $14 million for 15,076 patients (= $929/patient) versus $420 million for a similar traditional RCT (30x cheaper), yet pragmatic trials remain severely underfunded. PCORnet infrastructure enables real-world trials embedded in healthcare systems, but receives minimal support compared to basic research funding. Additional sources: https://commonfund.nih.gov/hcscollaboratory | https://pcornet.org/wp-content/uploads/2025/08/ADAPTABLE_Lay_Summary_21JUL2025.pdf | https://www.ncbi.nlm.nih.gov/pmc/articles/PMC5604499/
.2.
IQVIA Report. Global trial capacity. IQVIA Report: Clinical Trial Subjects Number Drops Due to Decline in COVID-19 Enrollment https://gmdpacademy.org/news/iqvia-report-clinical-trial-subjects-number-drops-due-to-decline-in-covid-19-enrollment/
1.9M participants annually (2022, post-COVID normalization from 4M peak in 2021) Additional sources: https://gmdpacademy.org/news/iqvia-report-clinical-trial-subjects-number-drops-due-to-decline-in-covid-19-enrollment/
.3.
Biotechnology Innovation Organization (BIO). BIO clinical development success rates 2011-2020. Biotechnology Innovation Organization (BIO) https://go.bio.org/rs/490-EHZ-999/images/ClinicalDevelopmentSuccessRates2011_2020.pdf (2021)
Phase I duration: 2.3 years average Total time to market (Phase I-III + approval): 10.5 years average Phase transition success rates: Phase I→II: 63.2%, Phase II→III: 30.7%, Phase III→Approval: 58.1% Overall probability of approval from Phase I: 12% Note: Largest publicly available study of clinical trial success rates. Efficacy lag = 10.5 - 2.3 = 8.2 years post-safety verification. Additional sources: https://go.bio.org/rs/490-EHZ-999/images/ClinicalDevelopmentSuccessRates2011_2020.pdf
.4.
SofproMed. Phase 3 cost per trial range. SofproMed https://www.sofpromed.com/how-much-does-a-clinical-trial-cost
Phase 3 clinical trials cost between $20 million and $282 million per trial, with significant variation by therapeutic area and trial complexity. Additional sources: https://www.sofpromed.com/how-much-does-a-clinical-trial-cost | https://www.cbo.gov/publication/57126
.5.
NHS England; Águas et al. RECOVERY trial global lives saved ( 1 million). NHS England: 1 Million Lives Saved https://www.england.nhs.uk/2021/03/covid-treatment-developed-in-the-nhs-saves-a-million-lives/ (2021)
Dexamethasone saved 1 million lives worldwide (NHS England estimate, March 2021, 9 months after discovery). UK alone: 22,000 lives saved. Methodology: Águas et al. Nature Communications 2021 estimated 650,000 lives (range: 240,000-1,400,000) for July-December 2020 alone, based on RECOVERY trial mortality reductions (36% for ventilated, 18% for oxygen-only patients) applied to global COVID hospitalizations. June 2020 announcement: Dexamethasone reduced deaths by up to 1/3 (ventilated patients), 1/5 (oxygen patients). Impact immediate: Adopted into standard care globally within hours of announcement. Additional sources: https://www.england.nhs.uk/2021/03/covid-treatment-developed-in-the-nhs-saves-a-million-lives/ | https://www.nature.com/articles/s41467-021-21134-2 | https://pharmaceutical-journal.com/article/news/steroid-has-saved-the-lives-of-one-million-covid-19-patients-worldwide-figures-show | https://www.recoverytrial.net/news/recovery-trial-celebrates-two-year-anniversary-of-life-saving-dexamethasone-result
.6.
FDA Study via NCBI. Trial costs, FDA study. FDA Study via NCBI https://www.ncbi.nlm.nih.gov/pmc/articles/PMC6248200/
Overall, the 138 clinical trials had an estimated median (IQR) cost of $19.0 million ($12.2 million-$33.1 million)... The clinical trials cost a median (IQR) of $41,117 ($31,802-$82,362) per patient. Additional sources: https://www.ncbi.nlm.nih.gov/pmc/articles/PMC6248200/
.7.
Lichtenberg, F. R. How many life-years have new drugs saved? A three-way fixed-effects analysis of 66 diseases in 27 countries, 2000-2013. International Health 11, 403–416 (2019)
Using 3-way fixed-effects methodology (disease-country-year) across 66 diseases in 22 countries, this study estimates that drugs launched after 1981 saved 148.7 million life-years in 2013 alone. The regression coefficients for drug launches 0-11 years prior (beta=-0.031, SE=0.008) and 12+ years prior (beta=-0.057, SE=0.013) on years of life lost are highly significant (p<0.0001). Confidence interval for life-years saved: 79.4M-239.8M (95 percent CI) based on propagated standard errors from Table 2.
8.
World Health Organization. WHO global health estimates 2024. World Health Organization https://www.who.int/data/gho/data/themes/mortality-and-global-health-estimates (2024)
Comprehensive mortality and morbidity data by cause, age, sex, country, and year Global mortality: 55-60 million deaths annually Lives saved by modern medicine (vaccines, cardiovascular drugs, oncology): 12M annually (conservative aggregate) Leading causes of death: Cardiovascular disease (17.9M), Cancer (10.3M), Respiratory disease (4.0M) Note: Baseline data for regulatory mortality analysis. Conservative estimate of pharmaceutical impact based on WHO immunization data (4.5M/year from vaccines) + cardiovascular interventions (3.3M/year) + oncology (1.5M/year) + other therapies. Additional sources: https://www.who.int/data/gho/data/themes/mortality-and-global-health-estimates
.Reuse
Copyright
© 2025 Mike P. Sinn